Data visualization has become a part of analyzing and understanding large amounts of data. In today’s data-driven world, the ability to transform raw datasets into digestible insights is invaluable. Windows users are fortunate to have access to a broad range of data visualization tools that help unravel complex information and present it in visually appealing and easy-to-understand ways. These tools enhance the analytical process and enable users to uncover patterns, trends, and relationships that might have otherwise remained hidden. Whether you are a data analyst, researcher, or simply curious about data visualization, this compilation will empower you to turn your datasets into compelling visual stories.
1. Tableau
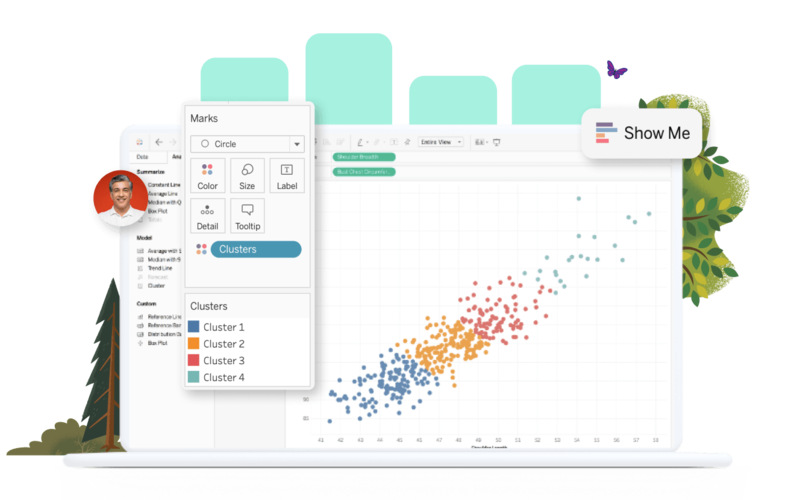
Tableau is a leading data visualization tool for Windows users. Its user-friendly interface and powerful capabilities allow users to create dynamic visualizations. It offers visualization options. It supports different data sources, making it perfect for exploratory analysis.
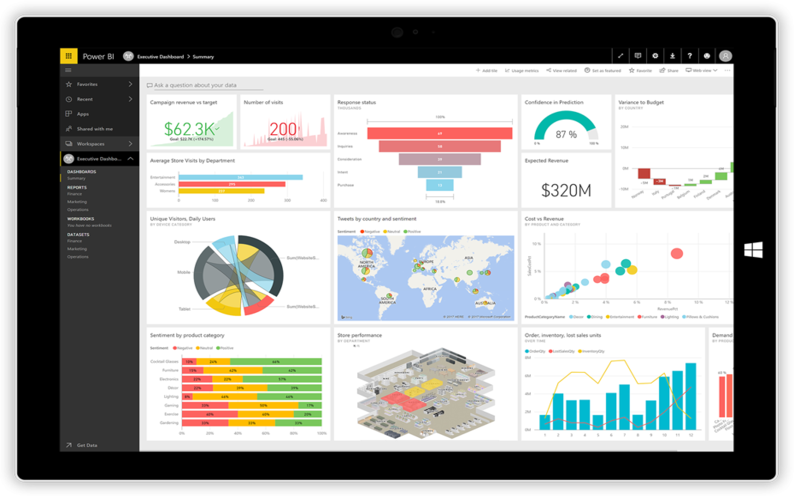
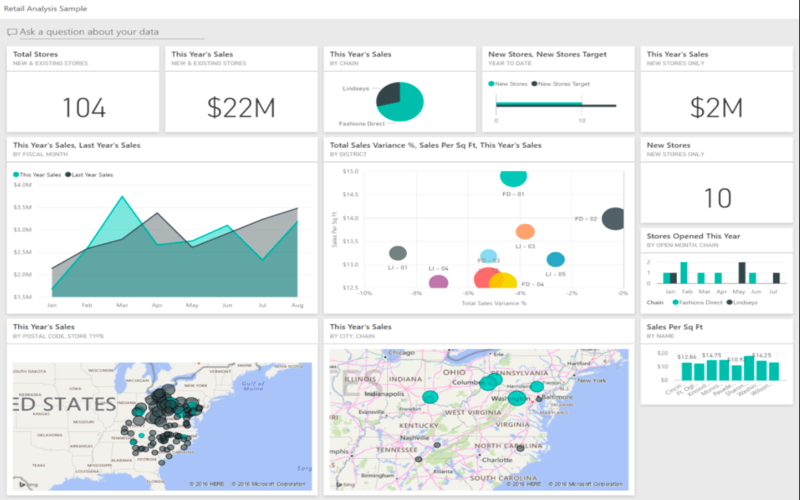
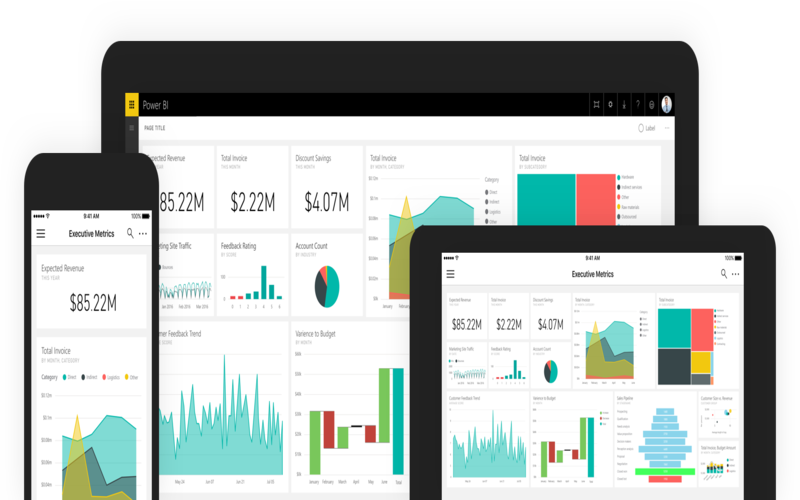
2. Power BI
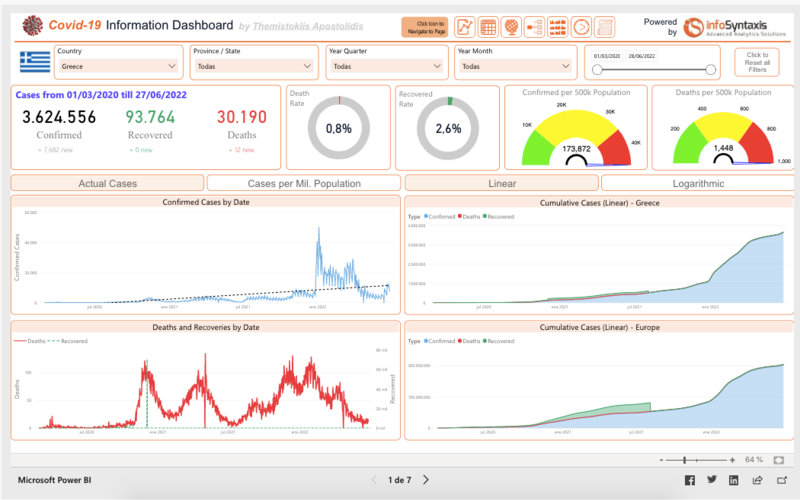
Power BI, developed by Microsoft, is a business intelligence tool that provides data visualization capabilities. With its drag-and-drop functionality, users can effortlessly create dashboards and reports. Power BI seamlessly integrates with Microsoft products, making it a popular choice among Windows users.
3. QlikView
QlikView stands out for its associative data discovery abilities. It enables users to explore data from multiple perspectives and uncover insights effortlessly. QlikView’s unique associative model allows users to make on-the-fly associations.

4. SAS Visual Analytics
SAS Visual Analytics is a software application designed for Windows users. It combines analytics capabilities with visualization features. This tool provides an array of visualization choices. Enables real-time analysis with SAS Visual Analytics, users can delve into data and visually uncover concealed patterns. Base their decisions on data-driven insights.
5. Domo
Domo provides a seamless experience for accessing and managing data from anywhere, anytime. The drag-and-drop feature simplifies creating dynamic visualizations, eliminating the need for complex coding or programming skills. Users can effortlessly transform raw data into meaningful insights. Furthermore, Domo’s collaboration platform fosters efficient teamwork by enabling multiple users to work on projects simultaneously. Team members can share their visualizations, data sets, and analysis in real-time, facilitating collaboration.
6. Google Data Studio
Google Data Studio is a tool for visualizing data that seamlessly integrates with Google products. It empowers users to generate reports and dashboards using data sources. The collaboration capabilities of Google Data Studio make it an excellent choice for teams engaged in data analysis projects.
7. Highcharts
Highcharts is a JavaScript-based library for creating chart options. It provides customization features. It Supports mobile devices as well. Highcharts are particularly popular among developers who embed visualizations into web applications and websites.

8. FusionCharts
FusionCharts, another JavaScript-based library, boasts a collection of charts and gauges. It offers features that enable users to craft visualizations with built-in animations and interactivity, greatly enhancing the overall user experience.

9. Dundas BI
Dundas BI stands out as a data visualization tool with customization options. It supports a range of data sources. Provides interactive dashboards, reports, and scorecards to meet diverse needs. Dundas BI’s is a flexible and versatile business intelligence and analytics tool. It offers a wide range of features for data exploration, visual analytics, and creating and sharing dashboards and reports. Dundas BI provides a variety of data visualization types, ETL (Extract, Transform, Load) capabilities, and robust security features. It allows users to connect and analyze data from various sources, making it a comprehensive solution for gaining insights from diverse datasets.

10. ThoughtSpot
ThoughtSpot, on the other hand, is a platform that combines intelligence and data visualization to provide augmented analytics. It empowers users to search and analyze data using natural language queries. ThoughtSpot’s user-friendly interface and robust search capabilities make it an excellent choice for data exploration and analysis.
11. Plotly
Plotly is an advanced data visualization tool with impressive features and capabilities. With Plotly, users can easily create publication-ready visualizations that are visually appealing and informative. It offers support for a wide range of chart types, including bar charts, line graphs, scatter plots, and more, making it suitable for various data visualization needs. From adjusting colors, fonts, and labels to adding annotations and interactive elements, Plotly provides the flexibility to create visually stunning and interactive charts.
12. SAP Lumira
SAP Lumira is a data visualization tool for Windows users. It provides the ability to model, visualize, and analyze data from various sources. With its user drag-and-drop functionality, users can create stunning representations of their data and gain deeper insights.

13. Chartio
Chartio is a cloud-based data visualization tool that offers an interface. Users can easily connect to data sources. Create visualizations by simply dragging and dropping elements. Its collaborative features make it effortless for teams on data analysis projects.
14. Looker
It boasts a modeling layer that empowers users to create data models. With Looker’s array of visualizations and interactive dashboards, analyzing data becomes more efficient, aiding decision-making processes.
15. Zoho Analytics
Zoho Analytics stands out as an all-encompassing business intelligence and data visualization tool. It provides a range of visualization options while enabling users to build dashboards and reports. Zoho Analytics also offers functionalities to blend data and perform analytics.

16. Cognos Analytics
Cognos Analytics is a high-quality data visualization and business intelligence tool for enterprises. It provides dashboards, self-service analytics, and advanced reporting features. Cognos Analytics allows users to view their data and collaborate on analysis projects.
17. MicroStrategy
MicroStrategy is a powerful business intelligence platform that provides robust data visualization capabilities. Whether it’s charts, graphs, maps, or grids, MicroStrategy offers the flexibility to choose the most suitable visualization format for conveying insights effectively. One standout feature of MicroStrategy is its support for interactive dashboards. These dashboards enable users to perform real-time analysis and exploration of their data, empowering them to dig deeper into trends, patterns, and anomalies. With interactive filters, drill-down capabilities, and dynamic report generation, users can gain actionable insights and make data-driven decisions on the fly.
18. Klipfolio
Klipfolio, on the other hand, is a cloud-based tool for data visualization that focuses on real-time metrics and dashboards. It boasts a range of integrations, making it connect and visualize data from various sources. With its real-time monitoring and alerting features, Klipfolio excels at tracking performance indicators.
19. Sisense
Sisense stands out as a modern business intelligence platform that seamlessly combines the power of AI-driven analytics with data visualization. Its user-friendly interface enables users to create dashboards and reports through a drag-and-drop approach. By harnessing Sisenses analytics capabilities, users can gain insights into their data effortlessly.
20. FineReport
Lastly, FineReport is a Java-based data visualization tool that offers a set of features. It provides options for visualizing data and supports customization through scripting. FineReports’ flexibility in deployment makes it well-suited for business environments.
Conclusion
Data visualization tools play a crucial role in analyzing and understanding data effectively. Here is a comprehensive list of 20 data visualization tools for Windows that can be highly beneficial for analysts, business owners, and enterprise users. These visualization tools likely offer visual options, such as charts, graphs, maps, and dashboards, allowing users to choose the most suitable format for their data analysis needs. Additionally, they may come with functionalities like interactive features, drill-down capabilities, and real-time data updates, enhancing the user’s ability to explore and understand their data dynamically and engagingly.