Linux monitoring commands play a crucial role in maintaining the efficient operation of a Linux system. These commands also provide valuable information about resource utilization, disk usage, and network connectivity. By utilizing these tools, system administrators can identify bottlenecks and troubleshoot issues. Ensure optimal functionality. In this guide, we will explore 20 Linux monitoring commands that assist in keeping track of the well-being and performance of a Linux system.
1. Top
The “top” command provides real-time information about running processes and the utilization of system resources. In addition to monitoring CPU usage and memory consumption, the “top” command offers a comprehensive view of running processes and their corresponding resource utilization. By sorting and filtering this information, administrators can quickly identify resource-intensive processes and take appropriate actions to optimize system performance and ensure efficient resource allocation. The “top” command is a valuable tool for managing system resources and troubleshooting performance issues on a Linux system.
2. Ps
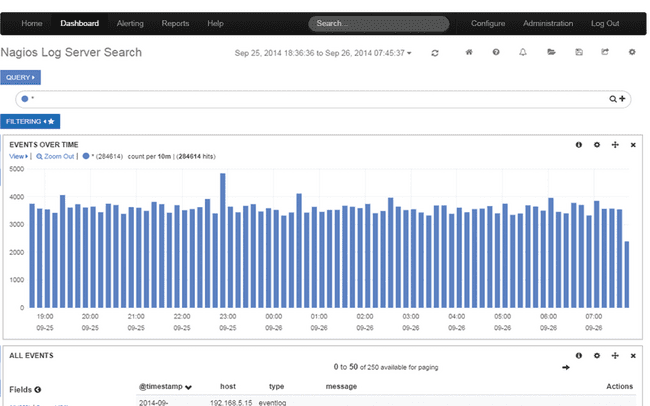
The “ps” command offers a snapshot of running processes. It helps identify the processes on the system along with their process ID (PID) and resource usage.
3. Htop
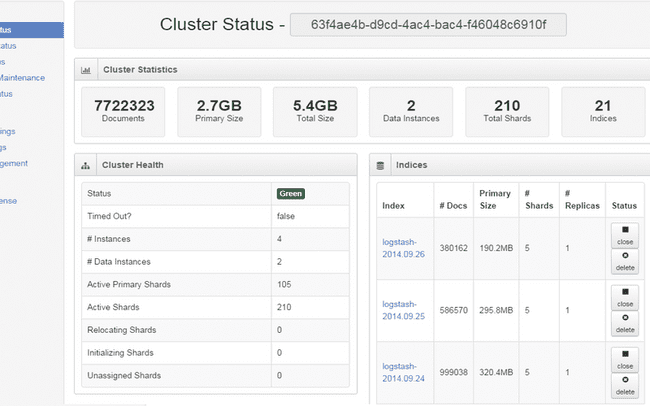
It acts as an interactive process viewer, allowing you to scroll through the list of processes, sort them based on criteria, and perform actions on them.

4. Iotop
“Iotop” is another command that keeps track of input/output (I/O) usage by processes on the system. It can be helpful to determine which processes are causing disk I/O and can assist in resolving performance problems related to disk usage.
5. Net Hogs
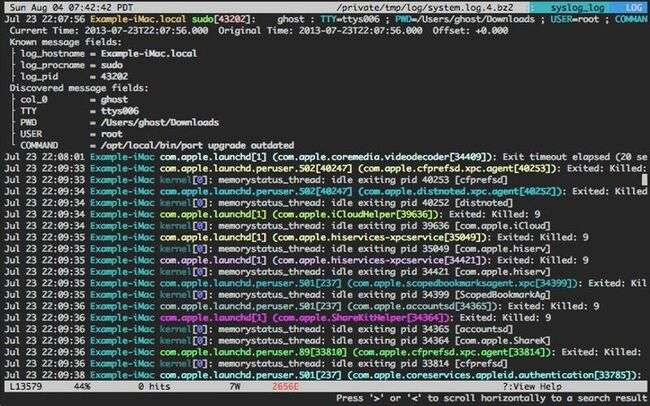
It shows network traffic for each process. You can identify the processes that consume the most network bandwidth and troubleshoot any performance issues related to the network.
6. If Top
It can help identify which IP addresses or hosts the most bandwidth on the network. This information can be crucial in managing network resources efficiently, optimizing traffic flow, and identifying potential bottlenecks or unauthorized usage.

7. Free
The free command provides details about memory usage and available system memory. It gives information about memory, used memory, free memory, and the memory used for buffers or caches.

8. Vmstat
The “vmstat” command is a powerful tool for monitoring system performance and identifying potential bottlenecks. It provides virtual memory statistics, including information on processes, memory utilization, paging activity, and CPU usage performance. By analyzing these statistics, administrators can identify abnormal behavior, such as high CPU usage or excessive paging, and take appropriate measures to address performance issues and optimize system resources. It can help identify any performance bottlenecks.
9. Sar
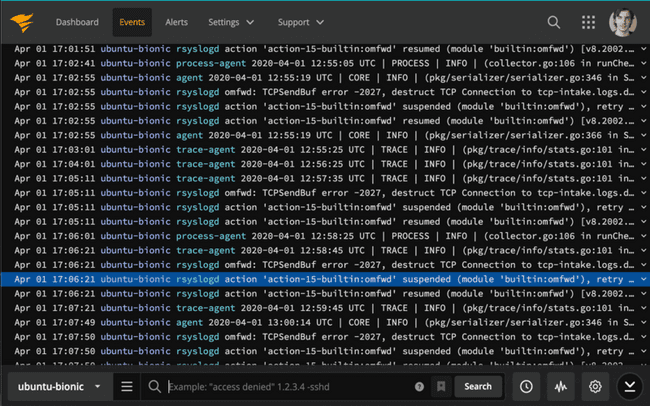
The SAR commands Report system activity information such as CPU usage, memory usage, disk I/O, and network utilization over some time. It is for analyzing performance monitoring systems and planning capacity.
10. Dstat
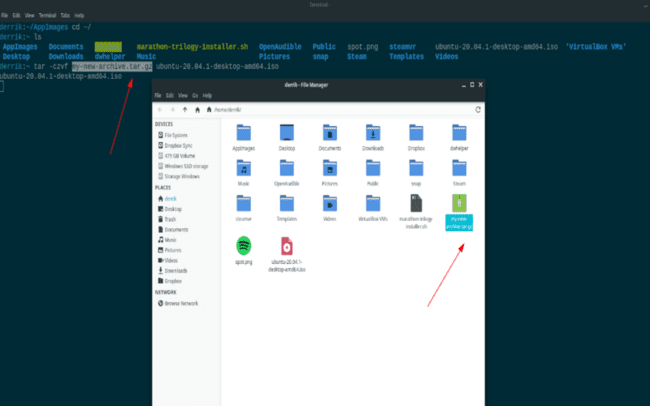
This command is a versatile tool for monitoring and analyzing system performance on a Linux system. By combining various system resource monitors, dstat offers a comprehensive view of real-time system performance. With its clear and concise interface, dstat is a popular choice among system administrators for identifying potential performance bottlenecks, monitoring resource utilization, and optimizing system performance. It is an essential tool for maintaining the efficient operation of a Linux system.
11. Io Stat
It displays input and output statistics for devices and partitions. It provides insights into disk utilization rates, I/O wait times, and throughput. It helps in identifying any performance problems related to disk I/O.
12. Netstat
Netstat displays information about network connections, routing tables, interface statistics, and multicast memberships. The “ss” command is a valuable tool for troubleshooting network-related issues and monitoring network connections.
13. Ss
The ss command is for diagnosing network issues, analyzing network performance, and identifying open ports that may pose a security risk. With its comprehensive socket statistics, ss is an essential command for any network administrator. It can show details about TCP, UDP, and UNIX domain sockets, such as connection status, packet and byte counts, and socket status.
14. Lsof
On the other hand, the ‘ls of’ command lists files and the processes responsible for opening them. In addition to its troubleshooting benefits, the ‘ls of’ command provides information for system administrators. It assists in monitoring file usage and identifying potential bottlenecks or resource constraints. By providing insight into the processes responsible for opening files, ‘ls of’ helps resource allocation and streamline system operations.
15. TCP Dump
With TCP dump, network administrators can gain valuable insights into network behavior and troubleshoot network-related issues. By capturing packets, they can analyze the communication between machines, identify suspicious or malicious activity, and detect potential vulnerabilities. The ability to filter packets based on various criteria enables targeted analysis, saving time and resources. Furthermore, the captured data can be analyzed offline, allowing for thorough examination and detailed reporting of network traffic patterns.
16. Ping
Ping is for diagnosing network connectivity issues and determining packet loss. By sending ICMP echo request packets to a target, administrators can assess the round-trip time (RTT) and evaluate the overall network performance. Ping is a simple yet effective tool that aids in troubleshooting network problems and optimizing network communication. Additionally, it provides valuable information for network administrators to ensure reliable and efficient connectivity.
17. Traceroute
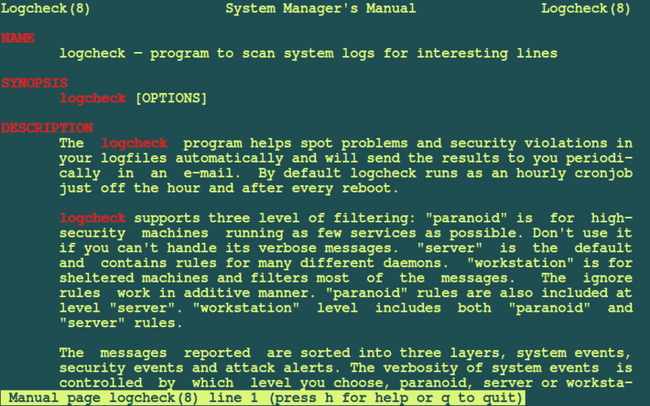
Traceroute is a command that shows the route and measures transit delays of packets across an IP network. In addition to troubleshooting network routing issues, Traceroute is also beneficial for network optimization and performance monitoring. It enables administrators to identify bottlenecks, excessively long hops, or congested network segments. Traceroute provides a comprehensive view of network infrastructure, assisting administrators in maintaining reliable networks.
18. Uptime
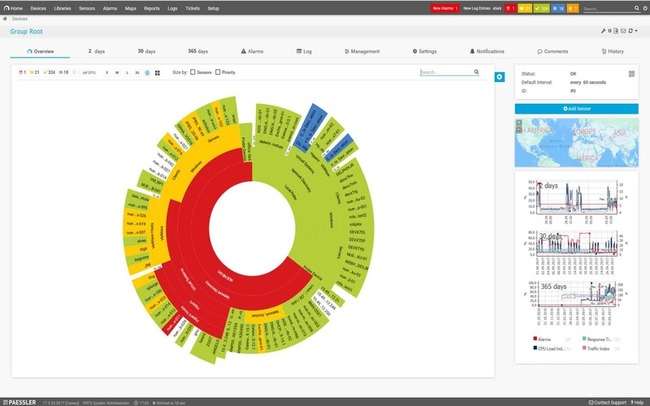
Uptime is a command that provides information about how the system has been running and the number of users currently logged in. It gives an overview of system performance. It Can help identify if there’s a high load on the system.
19. Watch
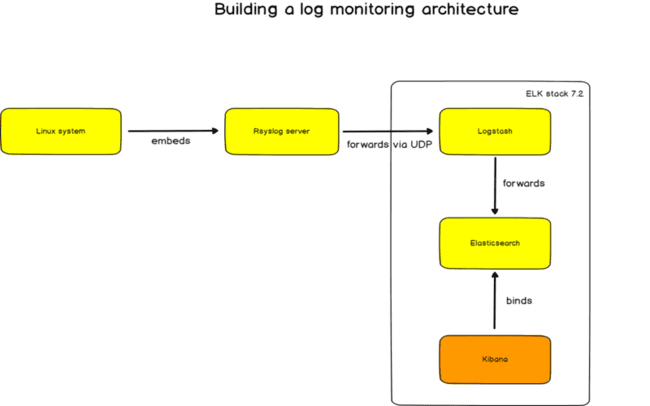
A watch is a command that repeatedly executes a specified command and displays its output in time. It’s handy for monitoring changes in the output of a command over time.
20. Journalctl
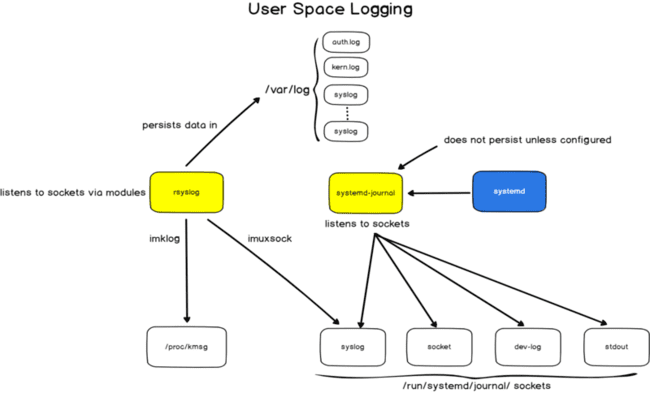
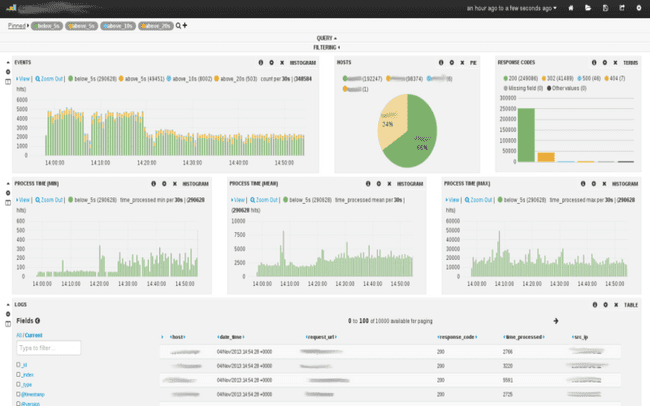
It is a command that allows you to view and manage system log messages stored in the system journal. It offers a means to explore system events, errors, and service logs. By familiarizing yourself with these monitoring commands, you will have the skills to pinpoint performance obstacles and resolve network concerns. It analyzes resource utilization and ensures the functioning of your Linux environment.
Conclusion
Linux monitoring commands provide valuable insights into system health and performance, allowing administrators to identify and resolve issues efficiently. Incorporating them into your system monitoring practices can enhance your ability to maintain a healthy and optimized Linux environment.

