Linux has become famous for administrators due to its flexibility, security, and stability. To ensure the operations of Linux systems, administrators rely on robust system monitoring tools that allow them to monitor and analyze aspects of their infrastructure. This post will cover the top 20 Linux system monitoring tools, their capabilities, and how they help system administrators manage their systems more successfully.
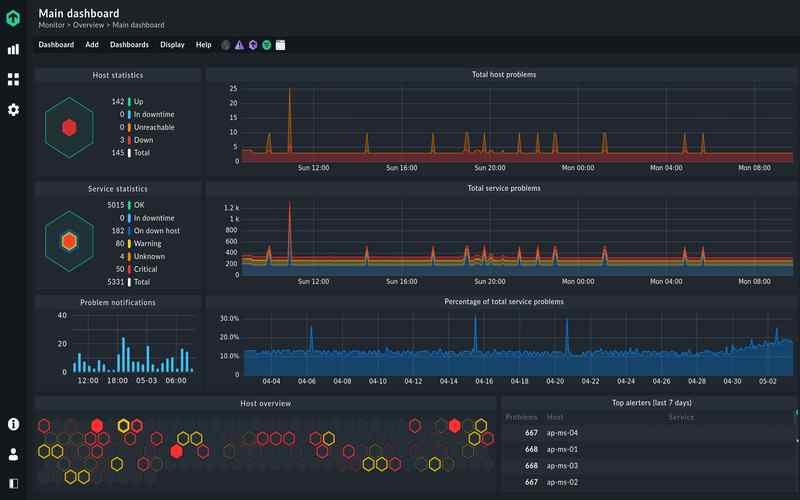
1. Nagios
Nagios offers a range of features, such as alerts, performance graphing capabilities, and an easy-to-use web-based interface for convenient management. Nagios provides real-time monitoring, proactive planning through trend analysis, and advanced reporting capabilities, all of which make it an indispensable tool for administrators.
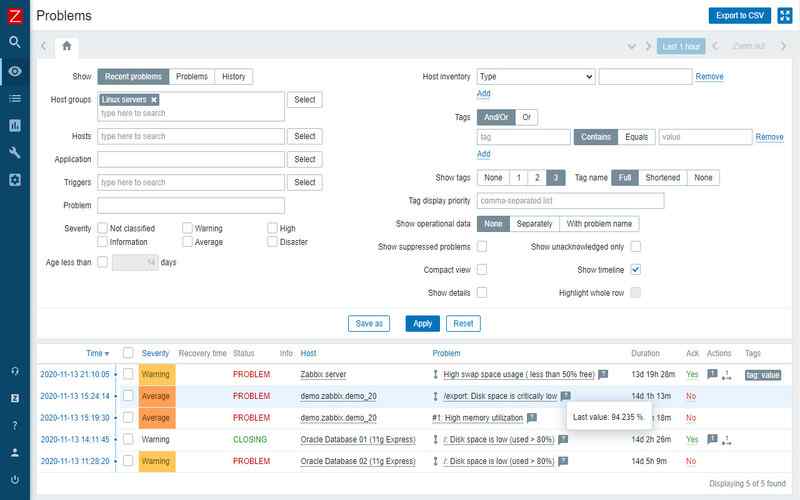
2. Zabbix
Zabbix is an enterprise-grade monitoring solution that provides real-time monitoring capabilities for networks, servers, and applications. Zabbix provides valuable capabilities for administrators, including distributed monitoring for environments, device auto-discovery, and a versatile notification system. These features make Zabbix a comprehensive tool for monitoring purposes.
3. Prometheus
Prometheus is a widely used monitoring toolkit highly regarded for its reliability and adaptability. It specializes in gathering and analyzing dimensional data, making it well-suited for complex monitoring needs. Prometheus focuses on collecting time series data, such as metrics related to CPU usage, memory utilization, and network traffic. It provides a robust data model, a flexible query language, and an intuitive visualization tool, making it a preferred choice for administrators.
4. Grafana
Grafana is a top-notch tool for visualizing and graphing data, mainly when used alongside Prometheus and other data sources. It empowers administrators to create dashboards customized to their liking through an interface. With various graphing options, such as charts, diagrams, and heatmaps, Grafana enables administrators to analyze and visualize system metrics effectively.
5. Cacti
Conversely, Cacti is a web-based network monitoring and graphing tool primarily focusing on Simple Network Management Protocol (SNMP) devices. Its primary function is. Displaying network information through graphs aids in optimizing networks and troubleshooting issues. Cacti simplifies device discovery processes while offering chart templating features, user management, and authentication support.
6. Sensu
Sensu emerges as a monitoring framework designed to cater to the needs of the dynamic and highly scalable environments prevalent today. Its versatility lies in supporting transport protocols that facilitate monitoring requirements. Administrators can use the Sensus plugin-driven architecture, enabling integration with systems and services.
7. Icinga
Icinga, derived initially from Nagios but now standing as an advanced monitoring system, delivers a top-tier monitoring solution for enterprise use. It offers scalability, performance, and user interface capabilities. It provides real-time monitoring, extensive reporting capabilities, and advanced alerting features.
8. Munin
Munin is a user-monitoring tool that offers capabilities for monitoring hosts, services, and networks. It allows administrators to gather data on system resources like CPU, memory, disk usage, and network activity. Administrators can create graphs, set alerts, and analyze system performance through the Munins interface.
9. The Telegraf Plugin Plugin
The Telegraf plugin plugin is a server agent specifically designed for collecting and reporting metrics from systems, databases, and services. It supports a range of input plugins to cater to monitoring requirements. The Telegraf plugin plugin simplifies the gathering process using an agent-based approach that locally collects and processes metrics before sending them to the monitoring system. With its flexibility and seamless integration capabilities, The Telegraf plugin plugin proves to be a tool for administrators looking for a solution for metric collection.
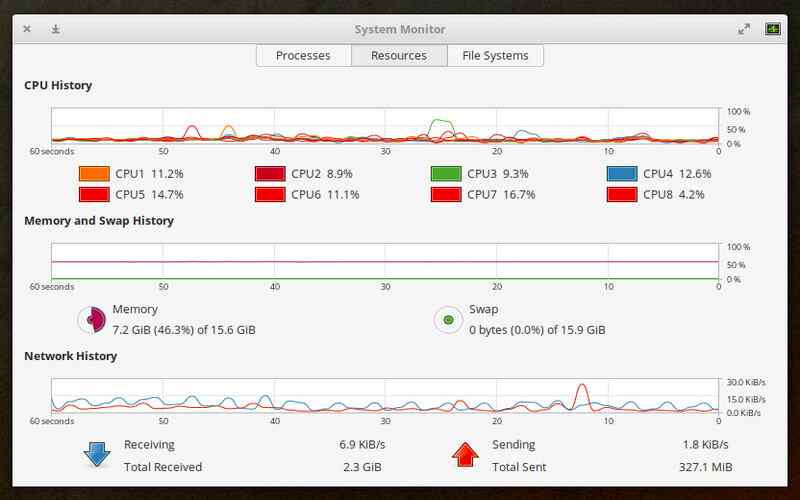
10. Netdata Performance Monitoring
Netdata Performance monitoring offers real-time system monitoring with insights into system performance. Its web-based dashboard visualizes metrics such as CPU usage, memory utilization, disk I/O operations, and network traffic. System administrators can use real-time monitoring to promptly identify and address performance concerns, ensuring optimal system performance. Netdata Performance monitoring is a tool among monitoring enthusiasts due to its user interface and efficient data collection capabilities.
11. Sysdig
For in-depth insights into system internals, Sysdig offers a troubleshooting and monitoring solution. It empowers administrators to capture information like system calls, filesystem activity, network activity, and more for analysis and troubleshooting. Sysdig offers a command-line interface (CLI) as well as a web-based graphical interface, making it accessible to both experienced and non-technical administrators. Its rich features, including real-time monitoring, event correlation, and powerful filtering capabilities, make it an invaluable tool for administrators managing complex Linux systems.
12. Monit
Monit is a monitoring tool that enables maintenance tasks based on predefined rules or thresholds. Administrators can utilize Monit to oversee processes, files, directories, system resources, and network services. Renowned for its simplicity and user interface, Monit is a choice for administrators seeking a straightforward and efficient monitoring solution. It offers real-time monitoring capabilities, customizable alerts, and the ability to automate actions to address system issues before they impact performance.
13. Collected
Collected is a daemon specifically designed to gather system performance statistics. It provides a range of plugins that allow administrators to monitor aspects of the system, such as CPU usage, memory utilization, disk I/O operations, network traffic, and more. With Collectd’s versatility and extensibility, administrators can easily configure it to collect data from sources and send it to a storage or monitoring system.

14. SAR
SAR (System Activity Reporter) is a command-line tool that offers insights into system activity. Administrators can employ SAR to monitor CPU activity levels, memory usage patterns, disk I/O operations statistics, network traffic measurements, and other essential system performance metrics.
15. Glances
Glances is a monitoring tool that works across platforms, focusing on being user-friendly and easy to use while offering functionality. It gives real-time updates on system resources, like CPU usage, memory consumption, disk I/O, and network activity. Glances have an interface that helps administrators quickly identify performance issues or bottlenecks.
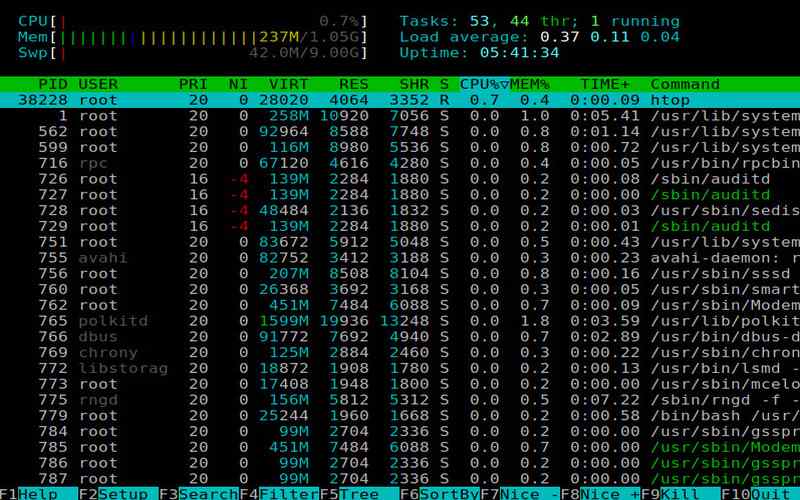
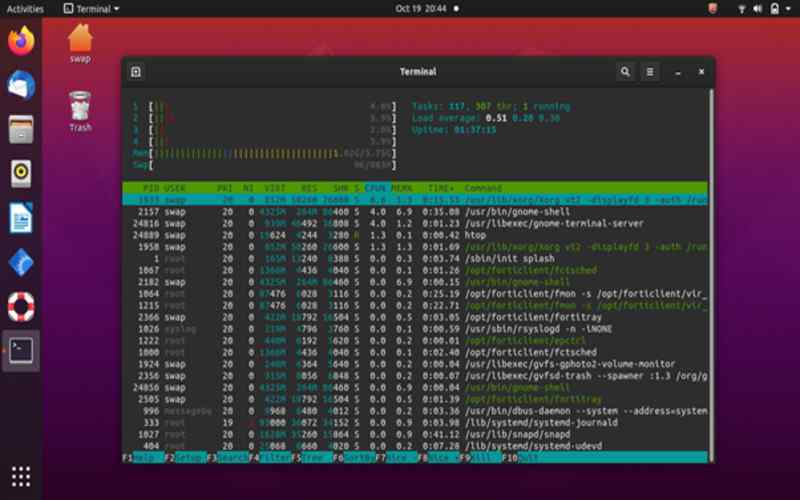
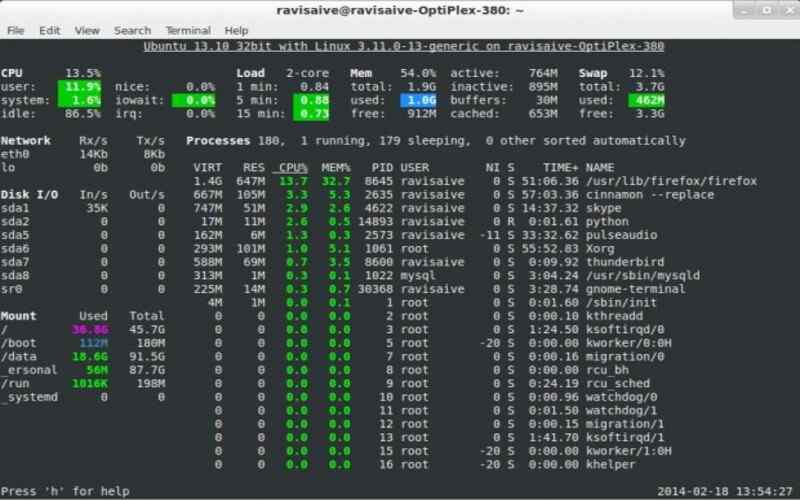
16. Htop
Htop is an enhanced version of the classic ‘top’ program, an interactive process viewer, and a system monitor. With Htop, you can scan processes, CPU usage, memory consumption, system load, and other essential system metrics in real-time. Its interface is intuitive and customizable, enabling administrators to sort and filter processes based on parameters.
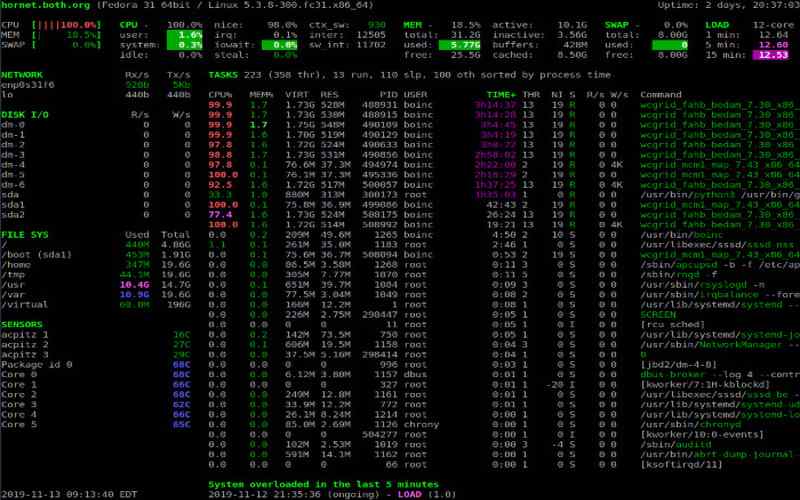
17. Atop
Atop is another tool that offers information on resource usage regarding processes, disks, and network activities. Atop provides statistics on CPU usage, memory usage, disk input and output, network activity, and various other system parameters. Real-time data collection and display facilitates high-level system performance monitoring for administrators.
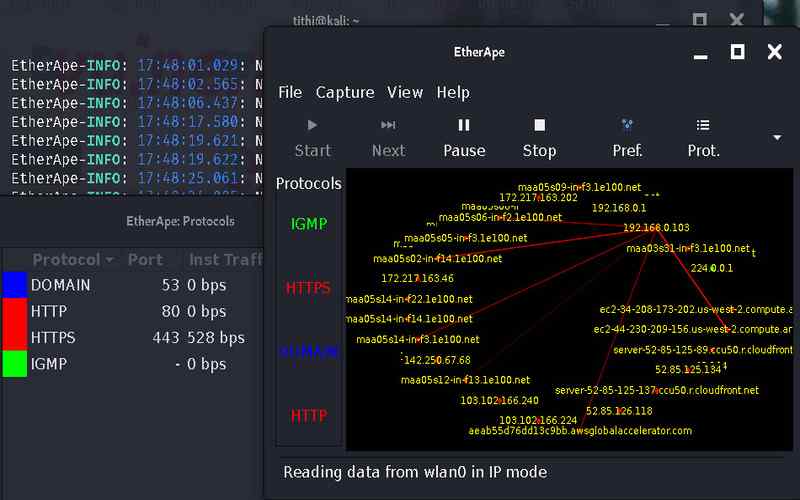
18. Ntopng
Ntopng allows administrators to analyze network traffic, protocols, and hosts in real time With Ntopng, administrators can keep track of network bandwidth, analyze traffic patterns, and detect any security threats using visually appealing dashboards. This tool supports real-time analysis, making it an efficient choice for network administrators who need monitoring capabilities.
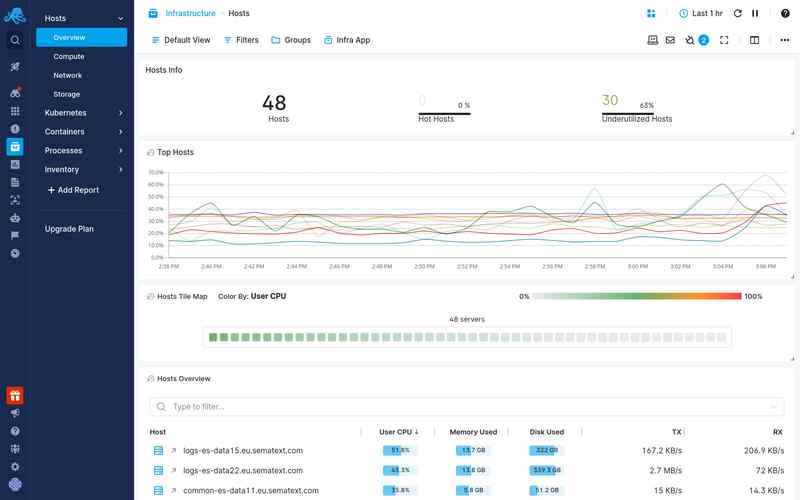
19. Filebeat
Filebeat is a log shipping solution designed to help administrators collect and forward log data to a centralized system for analysis. It seamlessly integrates with logging solutions like Elasticsearch, enabling administrators to aggregate and analyze logs from different sources. Filebeat simplifies the process of log collection and ensures the delivery of records. It proves invaluable for administrators aiming to centralize their logs and gain insights into system behavior as potential issues.
20. Elasticsearch
Elasticsearch is a distributed search engine primarily used for storing and analyzing log data. Its powerful indexing capabilities, efficient search algorithms, and real-time analytics make it an indispensable tool for system administrators. By leveraging Elasticsearch’s capabilities, administrators can extract insights from log data, monitor system behavior in real-time, and facilitate troubleshooting processes.
Conclusion
In conclusion, administrators must monitor Linux systems effectively to maintain optimal system performance, identify issues, and troubleshoot problems efficiently. By leveraging these tools, administrators can proactively enhance system performance, minimize downtime, and ensure the smooth operation of their Linux infrastructure.