Working with essential tools on the computer is fun, and Microsoft Excel is one of them. It is a versatile spreadsheet application empowering individuals and firms to manage and analyse data efficiently. It provides a structured grid layout where data is represented in rows and columns. It offers tools for data entry, computation, visualization, and automation. Its rich feature set, intuitive interface, and compatibility with other Microsoft Office applications for effective data management and analysis. From easy tasks such as creating a budget or tracking expenses to complex data modelling and analysis, it is an apt tool for professionals in finance, engineering, business, education, and research areas. Here are a few tips and tricks on Excel:
1. Keyboard Shortcuts
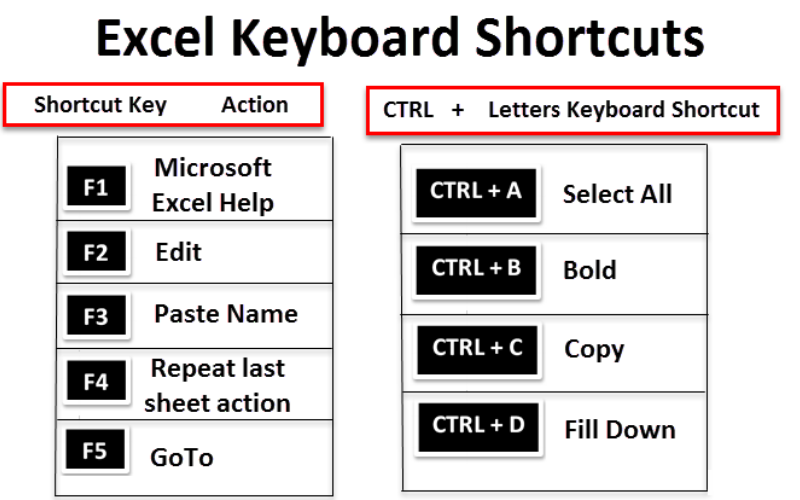
Keyboard shortcuts in Excel are key combinations that perform specific actions, helping you navigate and work with spreadsheets more efficiently. These shortcuts save time when performing easy tasks. For example, Ctrl+C is used to copy selected cells, Ctrl+V to paste, Ctrl+S to save your workbook, and Ctrl+Z to undo the last action.
2. Autofill
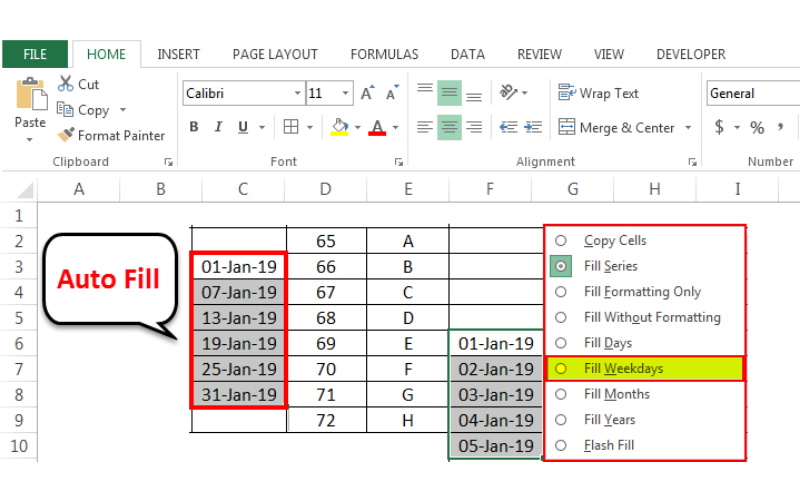
Autofill is a powerful feature that fills a data series or duplicate values based on a pattern. Drag the autofill handle (a small square at the cell’s bottom-right corner) down, and Excel automatically fills in the subsequent data based on that pattern.
3. Flash Fill
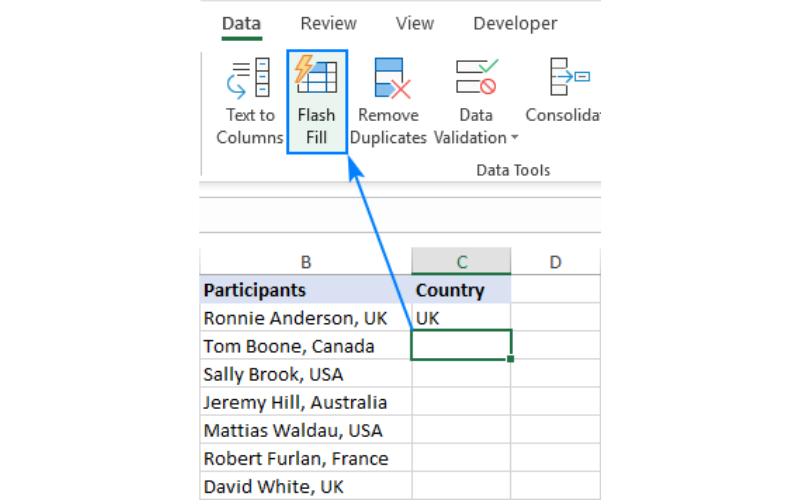
Flash Fill is a data manipulation tool in Excel to identify patterns in data and fill or transform adjacent cells automatically. If the column of names is in the format “First Name Last Name” and split them into separate columns, start typing the required format in nearby cells, and Excel will identify the pattern and suggest completing the process.
4. Format Painter
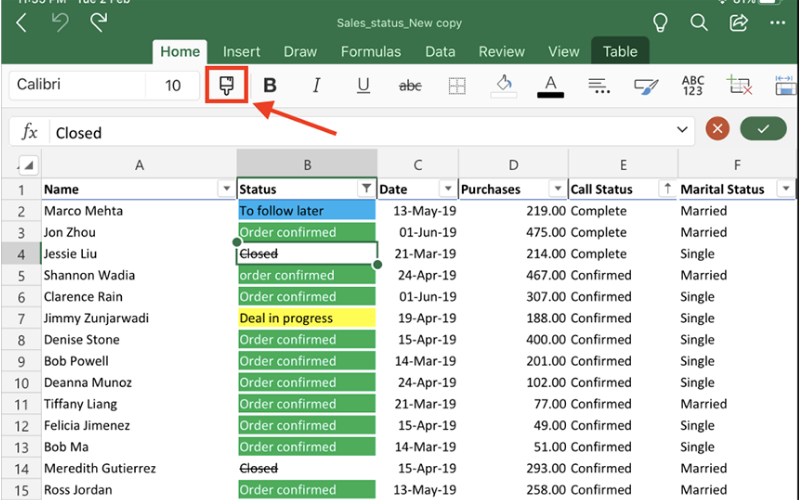
Format Painter is a handy tool for copying formatting (such as font, fill colour, and borders) from one cell and applying it to another. Select a cell with the desired formatting, click the Format Painter icon, and then click the cell(s) to use the same formatting. This feature maintains consistency in the spreadsheet’s appearance.
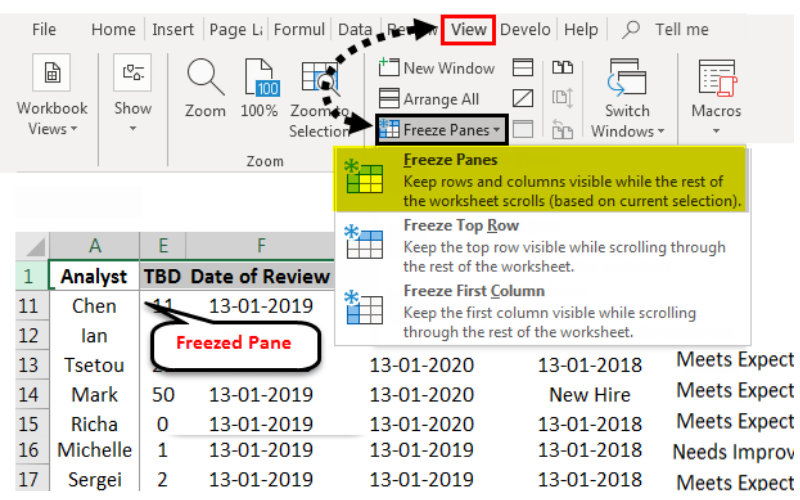
5. Freeze Panes
Freeze Panes lock specific rows or columns in place while scrolling through a large worksheet. It is used if there is a long list of data and to keep column headers visible as scrolling down occurs. It’s located under the View tab and provides options to freeze the top row, first column, or a specific number of rows and columns.
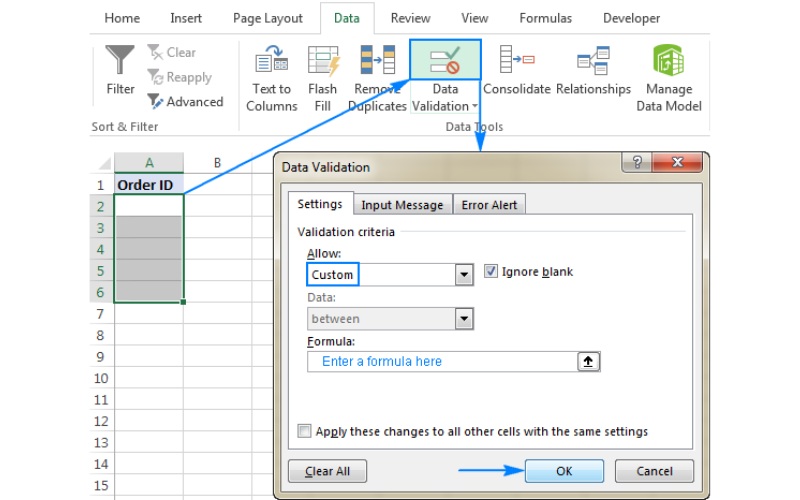
6. Data Validation
Data Validation is a feature permitting rules or restrictions on what is entered into a cell. If someone tries to enter data that doesn’t meet the criteria, it will display an error message, helping maintain data accuracy and consistency.
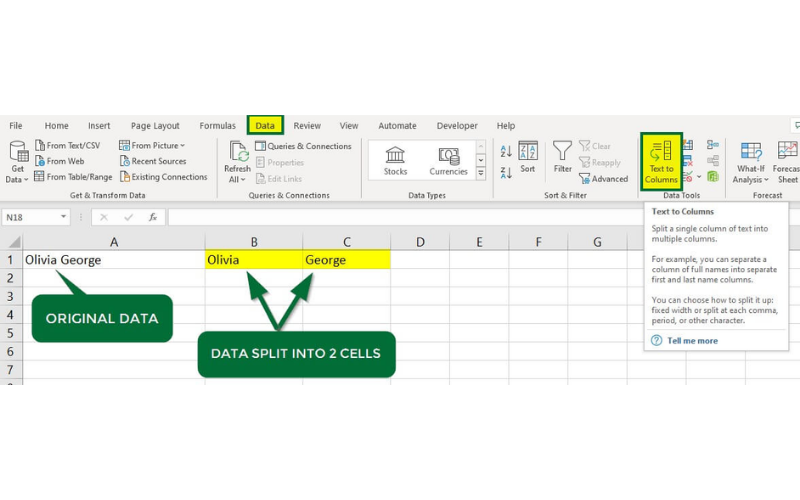
7. Text To Columns
Text to Columns feature splits a single column of text input into multiple columns based on a delimiter (e.g., comma, space, and tab). It’s useful when data has been pasted from another source and needs to be structured differently for analysis or presentation.
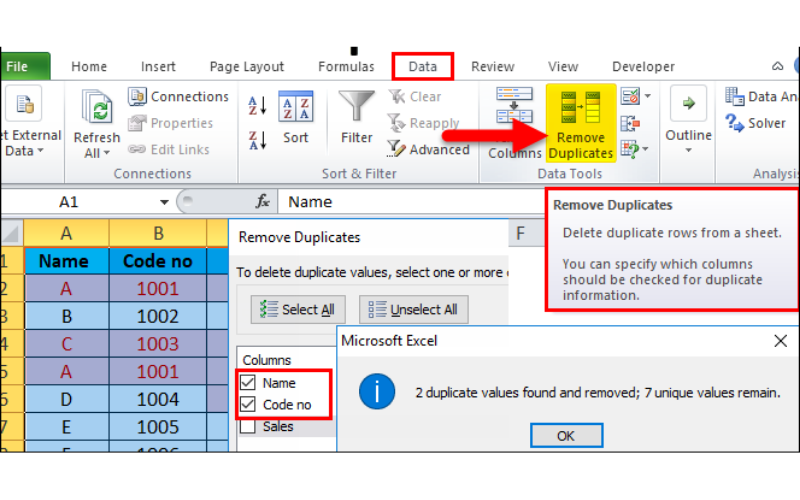
8. Remove Duplicates
Remove Duplicates is a tool that eliminates duplicate values from a range or column. This feature is essential for data cleansing, ensuring that datasets are free of redundant information. Specify which columns should be checked for duplicates, and Excel will automatically remove the extra occurrences.
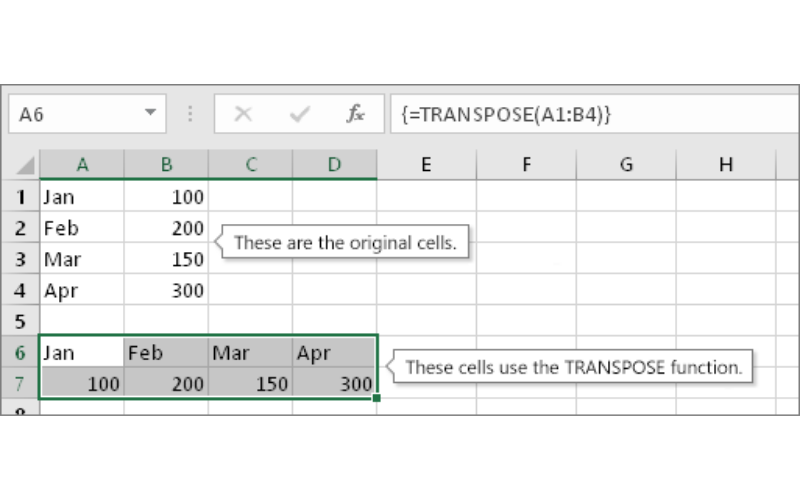
9. Transposing Data
Transposing data means switching rows to columns or vice versa. It’s handy when data is entered in rows but is required in columns or when reorientation of data for a different view or analysis is needed.
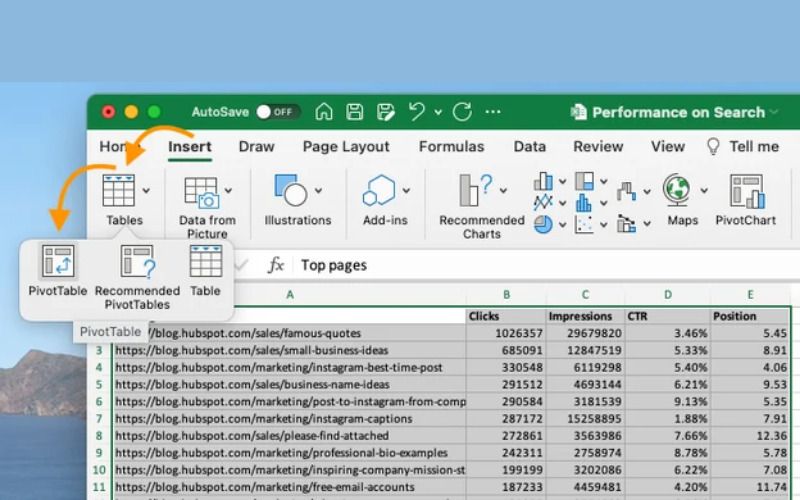
10. PivotTables
PivotTables are for summarising and analysing large datasets. They create customisable tables to summarise data to spot trends and answer specific questions. They can filter, group, and perform calculations on data, making complex data analysis much more accessible.
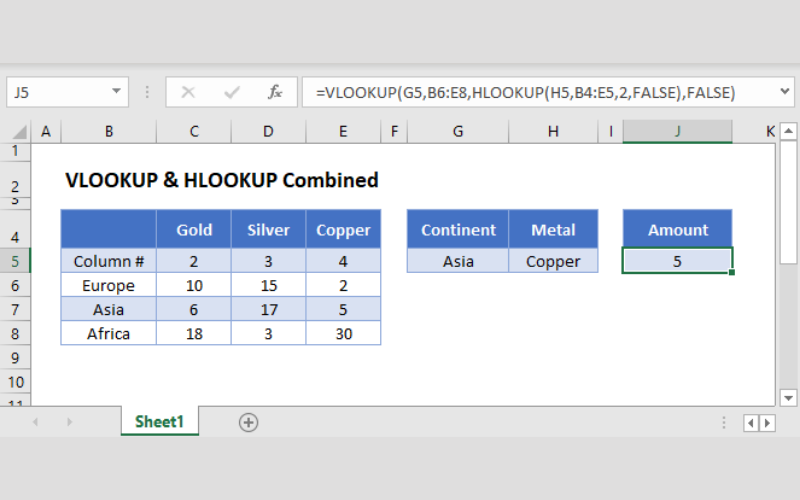
11. VLOOKUP And HLOOKUP
VLOOKUP and HLOOKUP functions search for a specific value in a table and return a corresponding value from a specified column or row. VLOOKUP searches vertically (down columns), while HLOOKUP looks horizontally (across rows). These functions are crucial for data retrieval and linking related information from different tables.
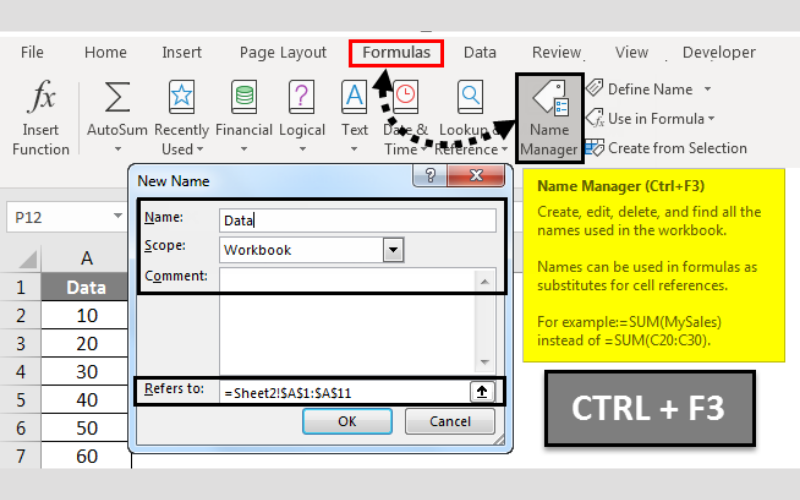
12. Named Ranges
Named Ranges are user-defined names assigned to specific cell ranges or single cells in Excel. They make it easier to refer to and work with data in formulas, especially in large and complex worksheets.
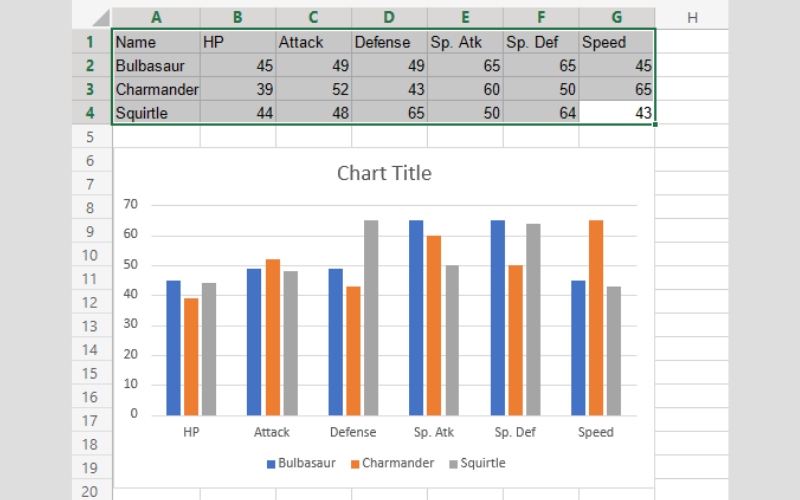
13. Charts
Charts are graphical representations of data to visualize trends, comparisons, and patterns in datasets. Excel offers various chart types such as bar charts, line charts, and pie charts. Charts are essential for creating compelling data presentations and reports.
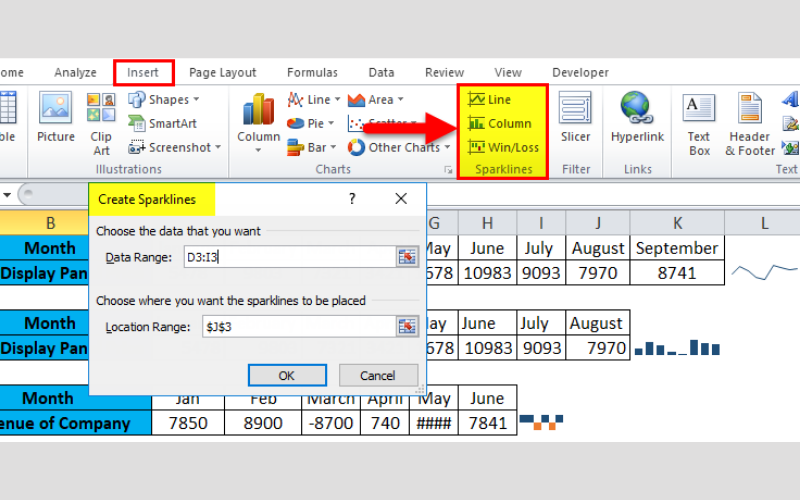
14. Sparklines
Sparklines are miniature charts fitting within a single cell. They provide a visual representation of data trends, making it easy to spot patterns and changes. They are great for showing trends in data like sales figures or stock prices over time, and they are where space is limited.
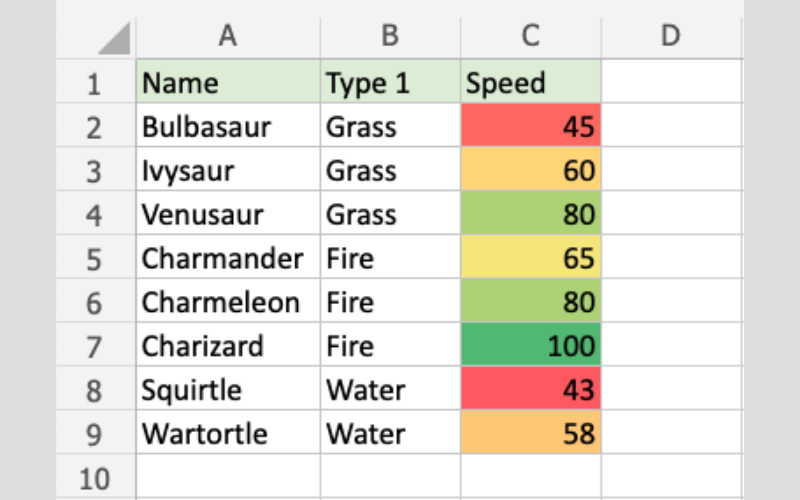
15. Conditional Formatting
Conditional Formatting feature helps highlight important information, identify outliers, and visualize data patterns. For example, conditional formatting colour cells that contain values above a certain threshold or the creation of data bars in cells to represent the magnitude of values.
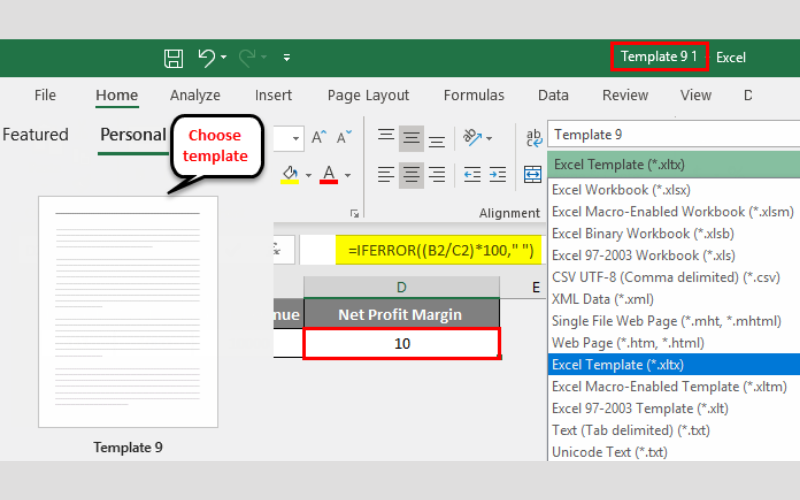
16. Custom Templates
Templates are pre-designed spreadsheets used as a starting point for several tasks. Custom templates or built-in templates can be used for functions like budgets, calendars, or project planning. Custom templates save time by providing a structured format for data and calculations.
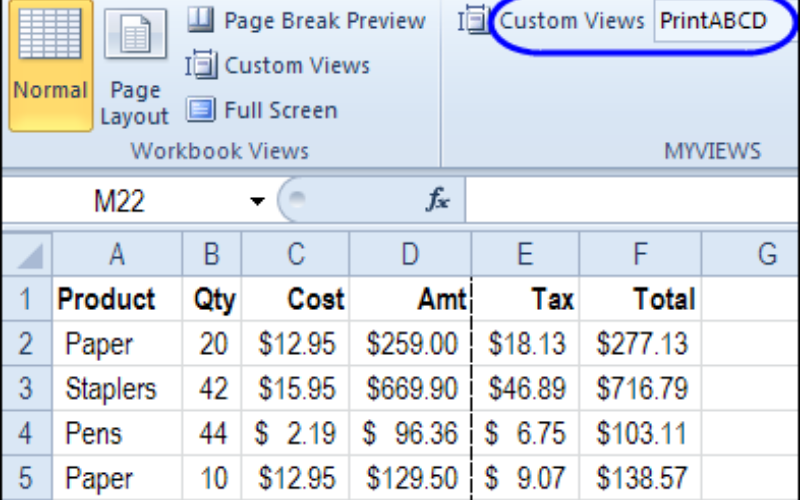
17. Custom Views
Custom Views save different display settings for a worksheet. It can include hiding or displaying specific rows or columns, applying different zoom levels, or adjusting print settings. Custom Views present the same data differently for different audiences or purposes.
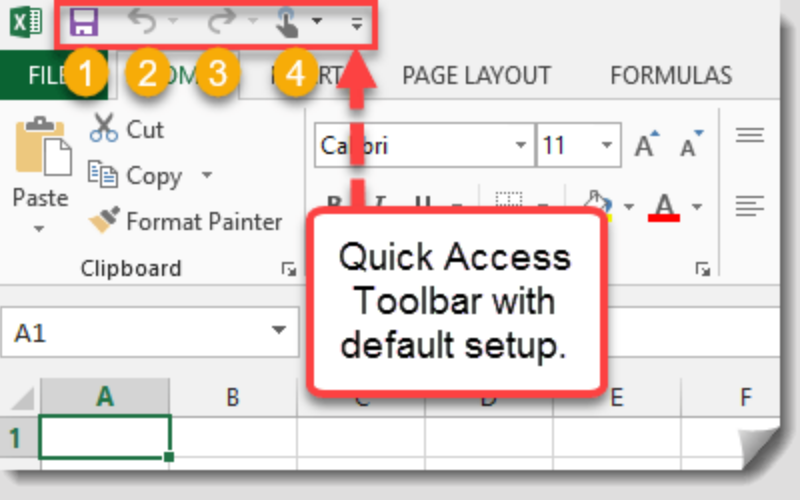
18. Quick Access Toolbar
Quick Access Toolbar is a customisable toolbar that provides easy access to frequently used commands. Buttons are added for functions like Save, Undo, Redo, and any other Excel commands used frequently. It streamlines the workflow and reduces the need to navigate by menus to access essential features.
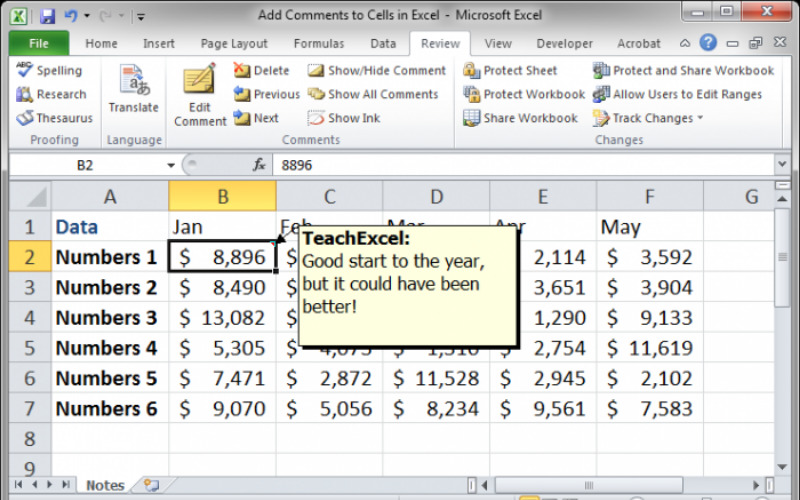
19. Cell Comments
Cell Comments (called cell notes) allow you to attach additional information or notes to specific cells in a worksheet. These comments can provide context or explanations for data, formulas, or calculations. They are used for collaboration when many people work on the same spreadsheet.
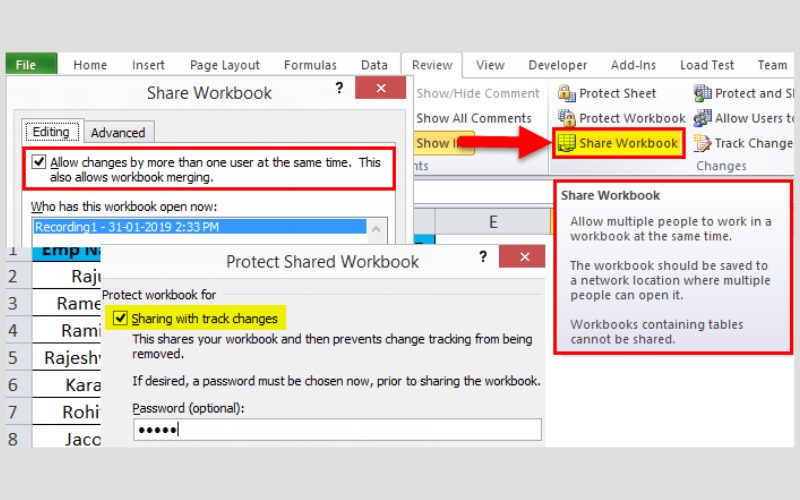
20. Shared Workbooks
Shared workbooks are a collaborative feature that allows multiple users to work on the same Excel workbook simultaneously. This feature collects input, feedback, or data from many people, such as team members or colleagues, and consolidates their contributions into a single document.

Twenty Excel Tips And Tricks
Working with essential tools on the computer is fun, and Microsoft Excel is one of them. It is a versatile spreadsheet application empowering individuals and firms to manage and analyse data efficiently. It provides a structured grid layout where data is represented in rows and columns. It offers tools for data entry, computation, visualization, and automation. Its rich feature set, intuitive interface, and compatibility with other Microsoft Office applications for effective data management and analysis. From easy tasks such as creating a budget or tracking expenses to complex data modelling and analysis, it is an apt tool for professionals in finance, engineering, business, education, and research areas. Here are a few tips and tricks on Excel:
1. Keyboard Shortcuts
Keyboard shortcuts in Excel are key combinations that perform specific actions, helping you navigate and work with spreadsheets more efficiently. These shortcuts save time when performing easy tasks. For example, Ctrl+C is used to copy selected cells, Ctrl+V to paste, Ctrl+S to save your workbook, and Ctrl+Z to undo the last action.
2. Autofill
Autofill is a powerful feature that fills a data series or duplicate values based on a pattern. Drag the autofill handle (a small square at the cell’s bottom-right corner) down, and Excel automatically fills in the subsequent data based on that pattern.
3. Flash Fill
Flash Fill is a data manipulation tool in Excel to identify patterns in data and fill or transform adjacent cells automatically. If the column of names is in the format “First Name Last Name” and split them into separate columns, start typing the required format in nearby cells, and Excel will identify the pattern and suggest completing the process.
4. Format Painter
Format Painter is a handy tool for copying formatting (such as font, fill colour, and borders) from one cell and applying it to another. Select a cell with the desired formatting, click the Format Painter icon, and then click the cell(s) to use the same formatting. This feature maintains consistency in the spreadsheet’s appearance.
5. Freeze Panes
Freeze Panes lock specific rows or columns in place while scrolling through a large worksheet. It is used if there is a long list of data and to keep column headers visible as scrolling down occurs. It’s located under the View tab and provides options to freeze the top row, first column, or a specific number of rows and columns.
6. Data Validation
Data Validation is a feature permitting rules or restrictions on what is entered into a cell. If someone tries to enter data that doesn’t meet the criteria, it will display an error message, helping maintain data accuracy and consistency.
7. Text To Columns
Text to Columns feature splits a single column of text input into multiple columns based on a delimiter (e.g., comma, space, and tab). It’s useful when data has been pasted from another source and needs to be structured differently for analysis or presentation.
8. Remove Duplicates
Remove Duplicates is a tool that eliminates duplicate values from a range or column. This feature is essential for data cleansing, ensuring that datasets are free of redundant information. Specify which columns should be checked for duplicates, and Excel will automatically remove the extra occurrences.
9. Transposing Data
Transposing data means switching rows to columns or vice versa. It’s handy when data is entered in rows but is required in columns or when reorientation of data for a different view or analysis is needed.
10. PivotTables
PivotTables are for summarising and analysing large datasets. They create customisable tables to summarise data to spot trends and answer specific questions. They can filter, group, and perform calculations on data, making complex data analysis much more accessible.
11. VLOOKUP And HLOOKUP
VLOOKUP and HLOOKUP functions search for a specific value in a table and return a corresponding value from a specified column or row. VLOOKUP searches vertically (down columns), while HLOOKUP looks horizontally (across rows). These functions are crucial for data retrieval and linking related information from different tables.
12. Named Ranges
Named Ranges are user-defined names assigned to specific cell ranges or single cells in Excel. They make it easier to refer to and work with data in formulas, especially in large and complex worksheets.
13. Charts
Charts are graphical representations of data to visualize trends, comparisons, and patterns in datasets. Excel offers various chart types such as bar charts, line charts, and pie charts. Charts are essential for creating compelling data presentations and reports.
14. Sparklines
Sparklines are miniature charts fitting within a single cell. They provide a visual representation of data trends, making it easy to spot patterns and changes. They are great for showing trends in data like sales figures or stock prices over time, and they are where space is limited.
15. Conditional Formatting
Conditional Formatting feature helps highlight important information, identify outliers, and visualize data patterns. For example, conditional formatting colour cells that contain values above a certain threshold or the creation of data bars in cells to represent the magnitude of values.
16. Custom Templates
Templates are pre-designed spreadsheets used as a starting point for several tasks. Custom templates or built-in templates can be used for functions like budgets, calendars, or project planning. Custom templates save time by providing a structured format for data and calculations.
17. Custom Views
Custom Views save different display settings for a worksheet. It can include hiding or displaying specific rows or columns, applying different zoom levels, or adjusting print settings. Custom Views present the same data differently for different audiences or purposes.
18. Quick Access Toolbar
Quick Access Toolbar is a customisable toolbar that provides easy access to frequently used commands. Buttons are added for functions like Save, Undo, Redo, and any other Excel commands used frequently. It streamlines the workflow and reduces the need to navigate by menus to access essential features.
19. Cell Comments
Cell Comments (called cell notes) allow you to attach additional information or notes to specific cells in a worksheet. These comments can provide context or explanations for data, formulas, or calculations. They are used for collaboration when many people work on the same spreadsheet.
20. Shared Workbooks
Shared workbooks are a collaborative feature that allows multiple users to work on the same Excel workbook simultaneously. This feature collects input, feedback, or data from many people, such as team members or colleagues, and consolidates their contributions into a single document.
Twenty Features Of Full-Stack Applications
Next PostTwenty Features Of Cybersecurity Tools
Related Posts
The Best NPS Tools For Enhancing Customer Satisfaction
The Best Knowledge Management Tools For Efficient Collaboration And Information Sharing
The Best Website Optimization Tools For Boosting Performance And User Experience
The Best Security Orchestration, Automation, And Response (SOAR) Tools
The Best Employee Timesheet Tools For Efficient Time Tracking And Management
Articles
The Best NPS Tools For Enhancing Customer Satisfaction
Businesses utilize the Net Promoter Score (NPS), a widely accepted statistic, to assess customer happiness and loyalty to them. This...
Read moreThe Best Knowledge Management Tools For Efficient Collaboration And Information Sharing
In today's fast-paced era, having access to knowledge is crucial for organizations. Effective knowledge management is for organizations of all...
Read moreThe Best Website Optimization Tools For Boosting Performance And User Experience
Website optimization tools achieve this goal by helping businesses analyze, improve, and maintain their websites to ensure optimal performance and...
Read moreThe Best Security Orchestration, Automation, And Response (SOAR) Tools
The increasing complexity and volume of cyber threats have made it necessary to implement security measures. Security Orchestration, Automation, and...
Read moreThe Best Employee Timesheet Tools For Efficient Time Tracking And Management
Employee time-tracking tools play a role in today's businesses. They aid organizations in monitoring and overseeing employee hours, ensuring invoicing,...
Read moreAndroid
Top 20 Best 4G Phones
The evolution of communication technologies has been a transformative journey, advancing from basic forms of communication to complex and interconnected...
Read moreTop 20 Sites To Host Websites
Modes of Communication have changed over the years. The Internet has become the fastest means of communication. The speed and...
Read moreTop 20 Keyword Research Tools
To have success in SEO strategy, keyword research is the boss. Without good keyword research, ranking high on search engines...
Read moreTop 20 Mind Games For Android Users
In today’s digital era, where smartphones have become one of the essential parts of our lives, almost 80% of today's...
Read moreTwenty Rare Phones in the World
The evolution of mobile phones has been remarkable from easy communication devices to effective pocket-sized computers. Alongside their generational advancements,...
Read moreiPhone
20 Facts About iPhone You Don’t Know
iPhone is one of the best-selling products worldwide; it needs no introduction. Apple Inc. developed a line of smartphones, which...
Read moreGadgets
Top 20 Keyword Research Tools
To have success in SEO strategy, keyword research is the boss. Without good keyword research, ranking high on search engines...
Read moreTwenty Rare Phones in the World
The evolution of mobile phones has been remarkable from easy communication devices to effective pocket-sized computers. Alongside their generational advancements,...
Read moreTop 20 Printers In Use
Printers are crucial devices used to produce hard copies of documents, pictures, and other digital content. When deciding on a...
Read moreTop 20 Ways In Which Human-Computer Interaction Will Be Beneficial
Design and research are done in the field of human-computer interaction (HCI) to show and understand how humans will interact...
Read moreTop 20 Essential Gadgets For Smartphones
Modern-day mobile phones are great. They have plenty of advanced features, but when a customer unboxes the smartphone, they get...
Read more