Data visualization is an integral part of data science as it offers appealing analytics in graphs and tables from huge data to enhance Business Intelligence. Power BI is one such tool. It is a business intelligence system developed by Microsoft that allows customers to visualise and analyze facts from several sources. It gives interactive dashboards, an intuitive interface, and rich visualization options. It permits users to connect to distinctive information sources, create custom reviews and dashboards, and share insights with others. It additionally provides robust data modelling and advanced analytics competencies. Below are some features of Power BI:
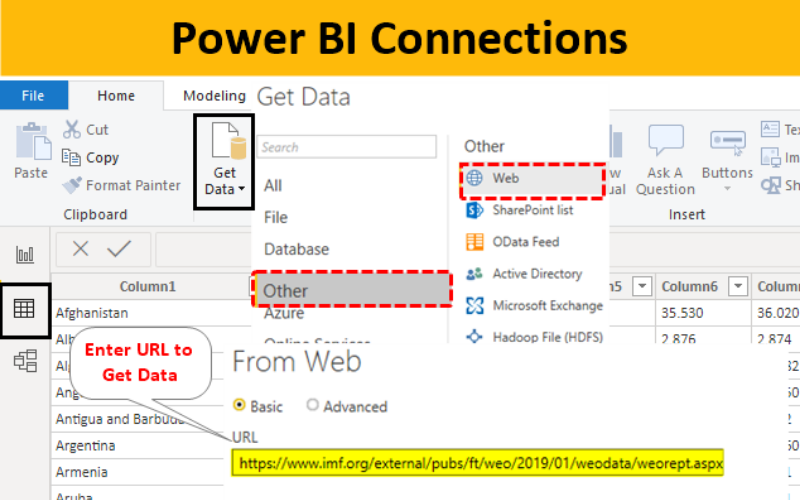
1. Data Connectivity
Data connectivity refers to the ability to connect to several data sources. It offers several options for connecting to data, including databases, cloud services, and web services. It accesses and analyses data from diverse sources seamlessly.
2. Data Transformation
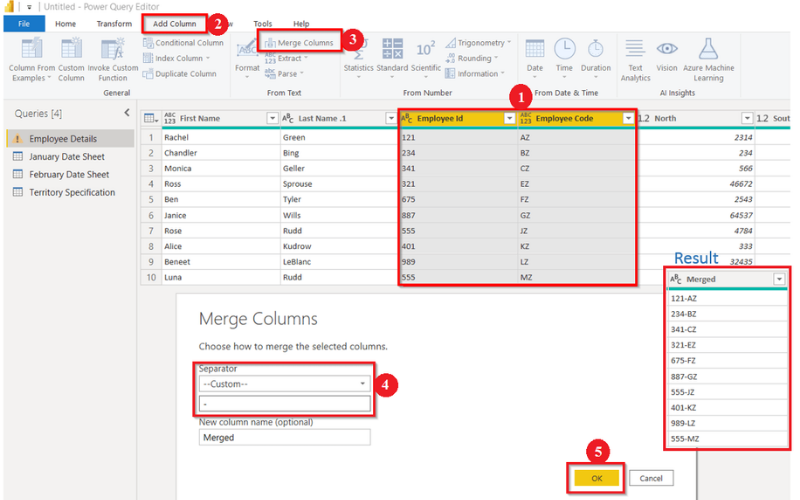
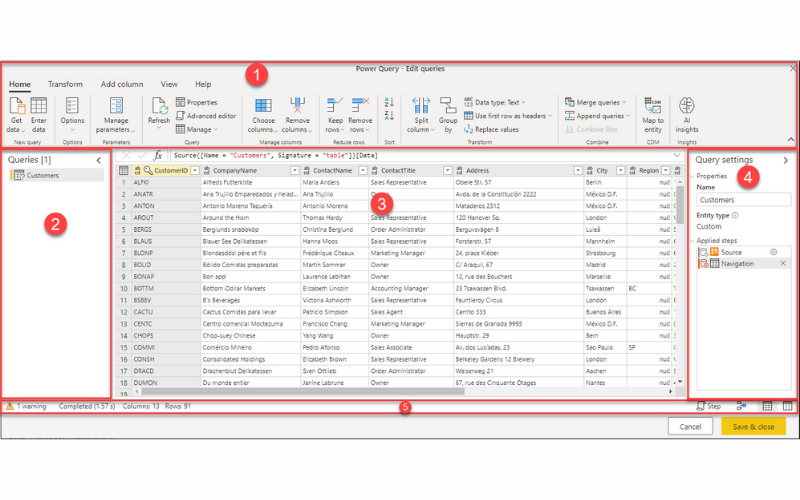
Power BI provides robust data transformation capabilities by Power Query, integrated into the Power BI Desktop. It aids in cleaning, shaping, and transforming your data before loading it into the data model. They can perform tasks like filtering rows, removing duplicates, pivoting columns, and merging data from multiple sources, ensuring data is in the correct format for analysis.
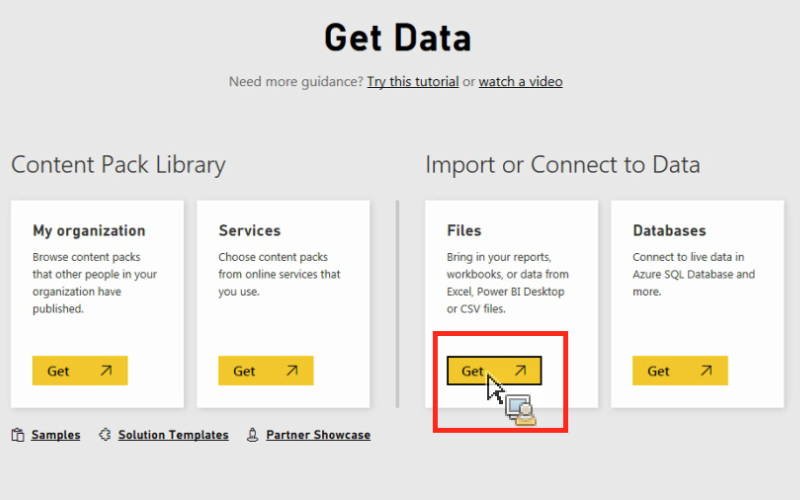
3. Data Import
Data import brings data from several sources into the Power BI project. It includes data loading options including, creating queries, loading data to the data model, and performing transformations. It aids in creating meaningful visualisations and reports.
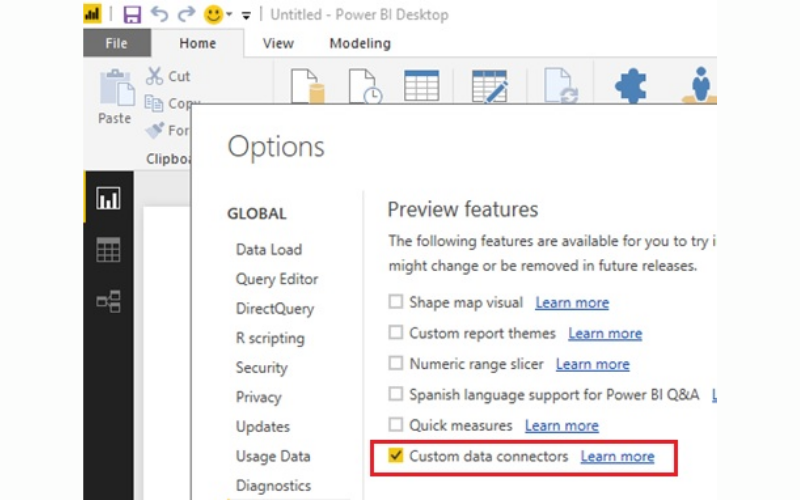
4. Custom Data Connectors
While Power BI offers a wide array of native connectors, at times there is a need to connect to a data source that doesn’t have a built-in connector. Custom data connectors feature creates connectors or leverages community-contributed connectors, extending Power BI’s capabilities to connect to virtually any data source.
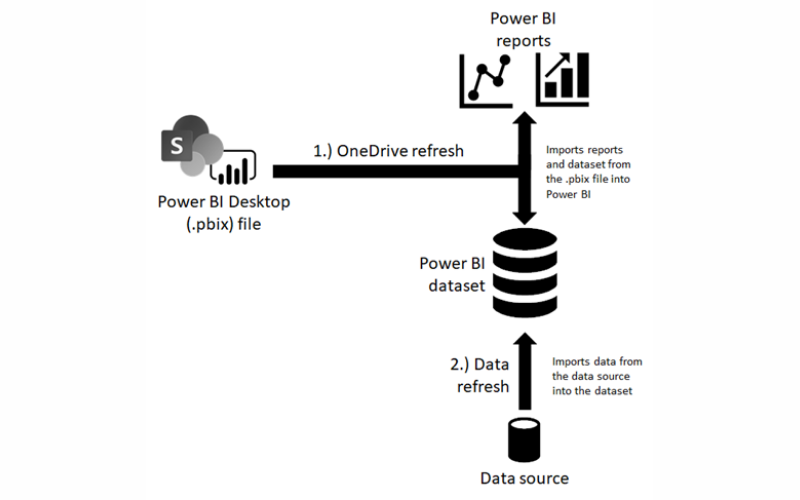
5. Data Refresh
Data refresh is essential for keeping Power BI reports up to date with the latest data. The schedule automatic data refreshes in the Power BI service, ensuring that the reports and dashboards always reflect the most current information.
6. DAX Language
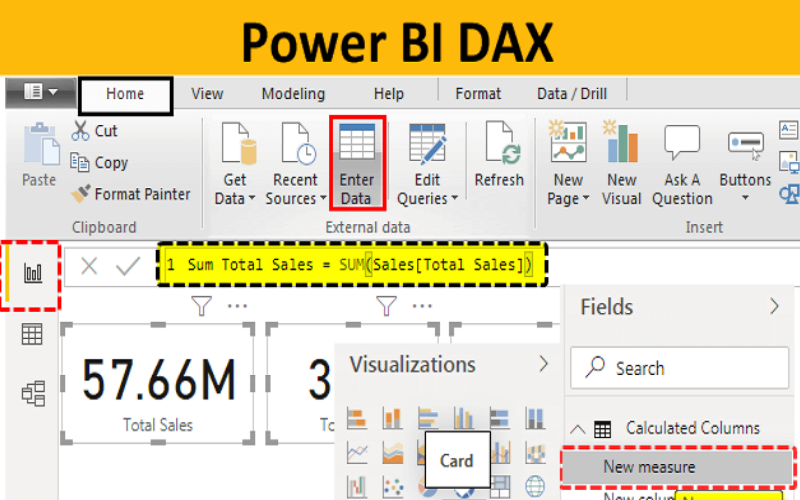
Data Analysis Expressions (DAX) language is a formula language used in Power BI for creating custom calculations and aggregations. It allows users to define complex business logic and metrics, such as year-to-date calculations, running totals, and custom KPIs within their data model.
7. Query Editor
Query Editor is a visual interface within Power BI that performs data transformation tasks interactively. It can easily filter rows, remove or replace values, pivot and unpivot columns, and merge data from various sources.
8. Interactive Reports
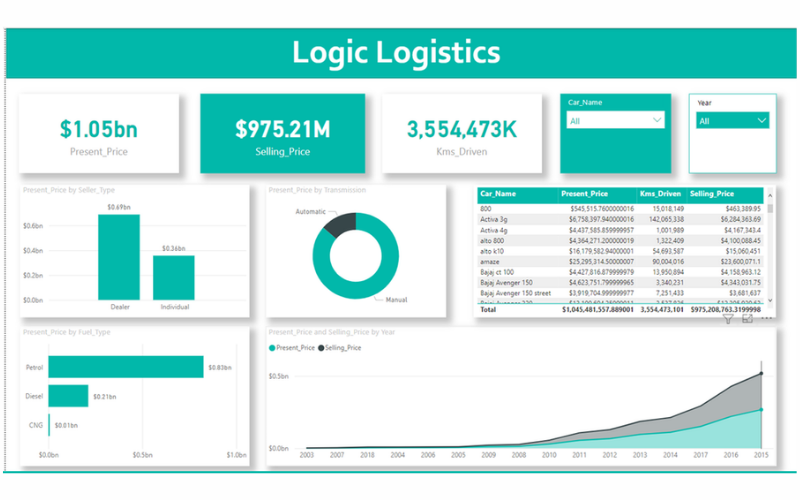
Interactive reports enable users to create dynamic, user-friendly reports that respond to user interactions. Users can drill down into data, filter visualizations, and explore details simply by clicking on elements within a report. This feature enhances the user experience and allows for deeper data exploration.
9. Rich Visualizations
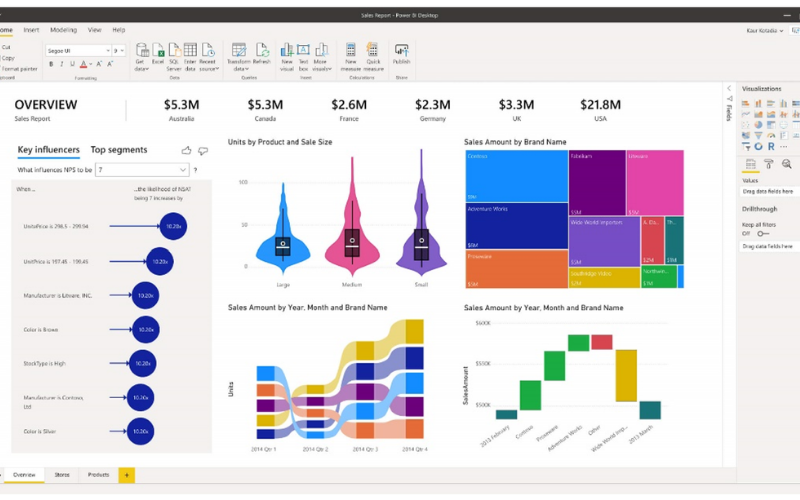
Power BI offers visualization types, from basic bar charts to advanced tree maps and heat maps. Rich visualizations help users represent data in the most meaningful and engaging way. They can be customised to match specific business requirements.’
10. Custom Visuals
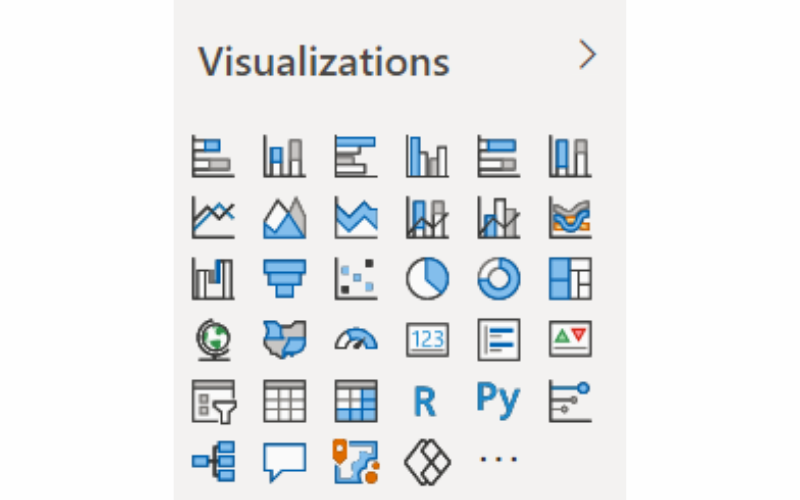
Custom visuals aid users in extending their reporting capabilities. Developers and third-party vendors can create custom visuals that can be imported and used within Power BI reports. This feature ensures flexibility in visualizing data beyond the standard offerings.
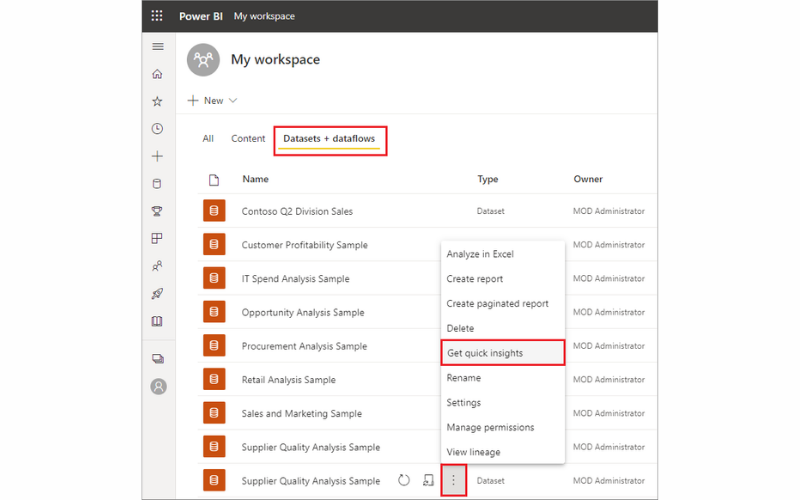
11. Quick Insights
Quick Insights is an automated feature in Power BI that scans data and provides users with valuable insights and patterns that may not be immediately apparent. It can suggest interesting correlations, outliers, and trends, helping users discover insights that have been missed.
12. Dashboards
Dashboards in Power BI are collections of visuals and reports organised on a single canvas. They offer an at-a-glance view of critical metrics and KPIs. Users can pin individual visuals from different reports to a dashboard, allowing for a consolidated view of data and facilitating the monitoring of key business metrics.

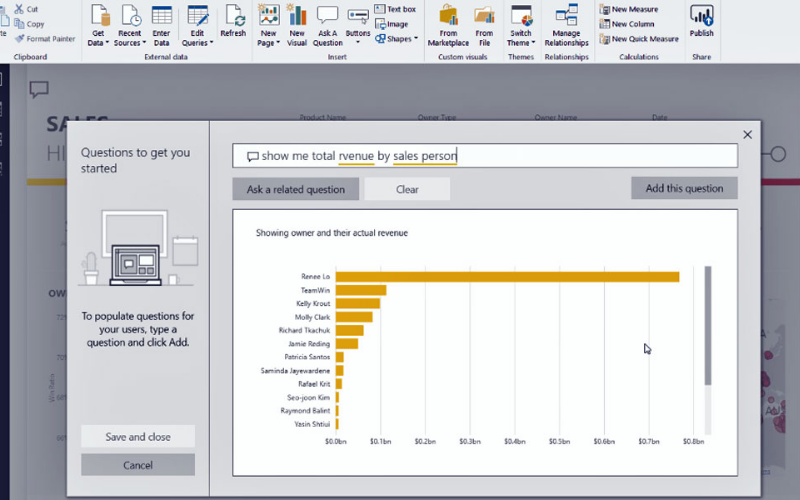
13. Natural Language Queries
Natural Language Query capabilities allow users to ask questions about their data in plain, conversational language. Users can type or speak queries, and Power BI generates visualizations and reports based on those queries. This feature makes data analysis more accessible to a broader audience.
14. Data Alerts
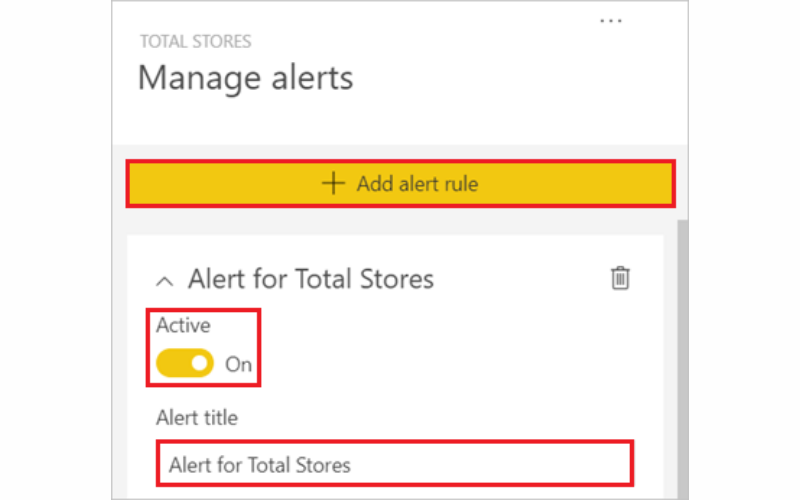
Data alerts in Power BI enable users to set up notifications based on certain conditions or thresholds in their data. When these conditions are satisfied, Power BI send email notifications or triggers other actions, ensuring that users stay informed about significant changes or events in their data.
15. Cross-Filtering
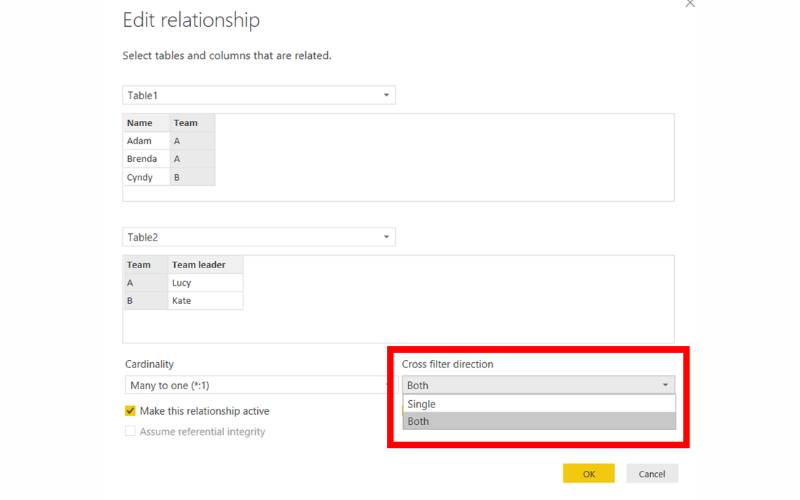
Cross-filtering allows users to filter data across multiple visuals on a report. When a user selects data points on visualization, the other visuals on the report adjust to show relevant data based on the selection. This feature facilitates comprehensive data exploration.
16. Drill-Through
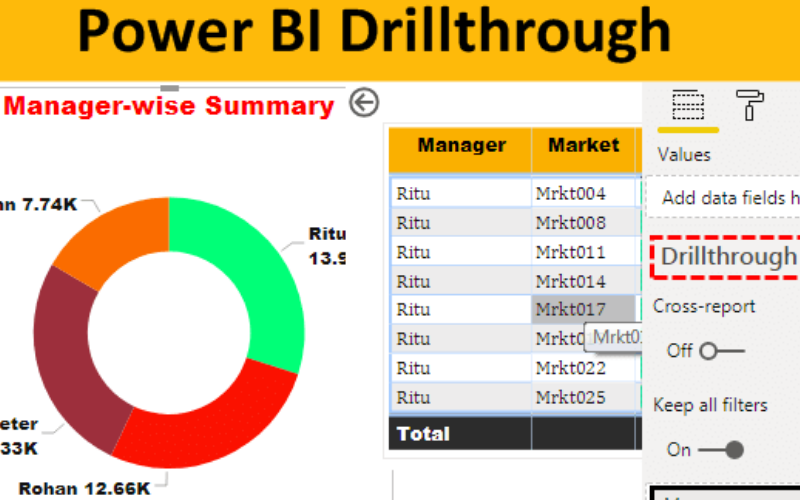
Drill-through enables users to navigate from a summary report to detailed information. Users can click on data points or elements in visualization to access a separate drill-through page or report that provides more granular data related to their selection. It helps users investigate data at various levels of detail.
17. Mobile Optimization
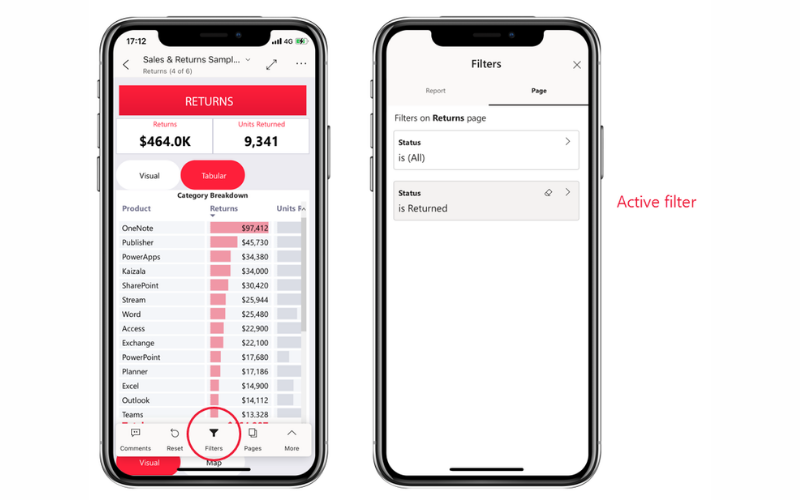
Mobile optimization ensures reports and dashboards are accessible and functional on several mobile devices, including smartphones and tablets. It offers a mobile-first approach to report and dashboard design. Users can create responsive reports that adapt to different screen sizes, orientations, and touch gestures on mobile devices.
18. Export And Sharing
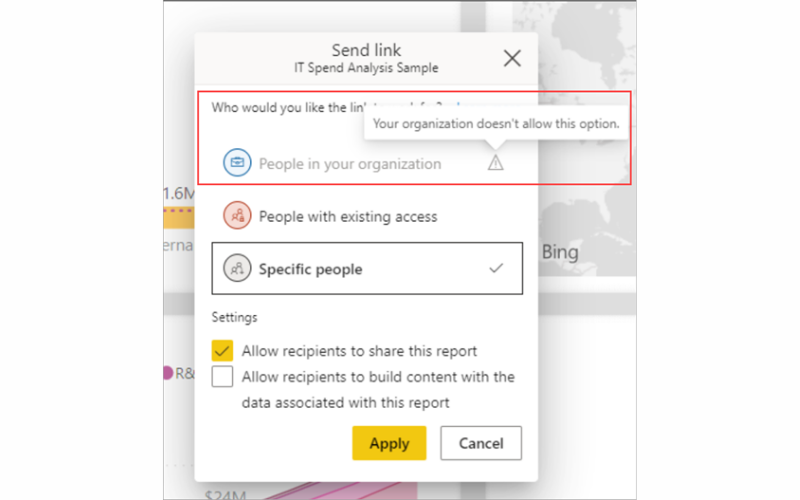
Power BI offers robust export and sharing capabilities that enable users to distribute reports and dashboards to stakeholders within and outside their organisation. It permits users to export reports and dashboards in formats, such as PDF, PowerPoint, Excel, and CSV.
19. Embedding
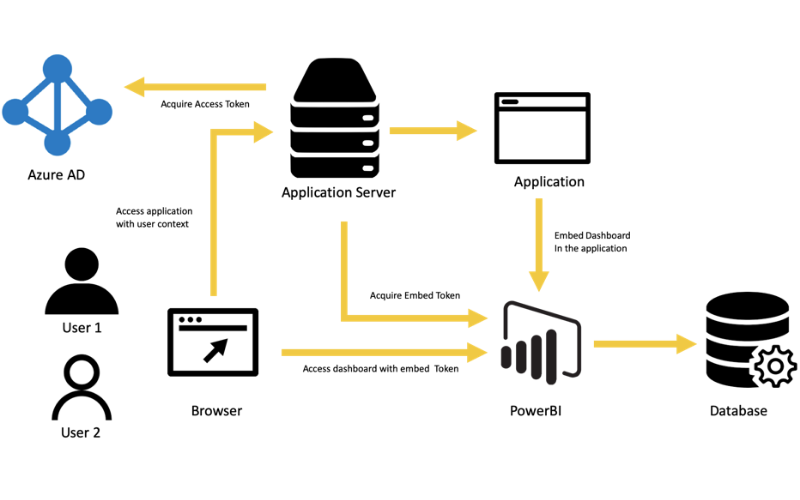
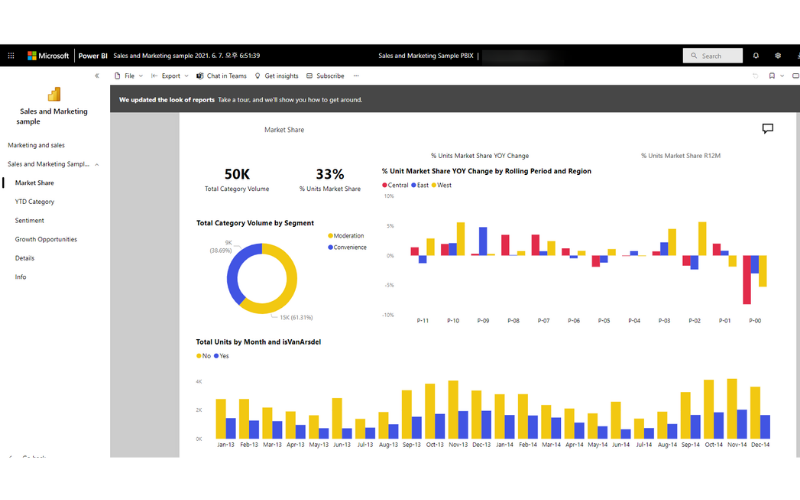
Embedding capabilities enable businesses to integrate reports and dashboards directly into other websites, applications, or portals. Organisations can embed reports into customer-facing applications or portals, permitting customers to access data and analytics without leaving the application.
20. Row-Level Security
Row-level security is a security feature that allows organizations to control data access at a granular level based on user roles and data filters. Administrators can define user roles and associate specific roles with data filters. This means that users only see data that is relevant to their role.
